| - Acid Neutralizing Capacity (ANC; as CaCO3), UNF, TITR - |
| Lab: NWQL, PCode: 90410, MCode: TT040 |
| Login Dates: 10/14/86 through 09/27/01 |
| Open Data Set |
| Boxplot Description |
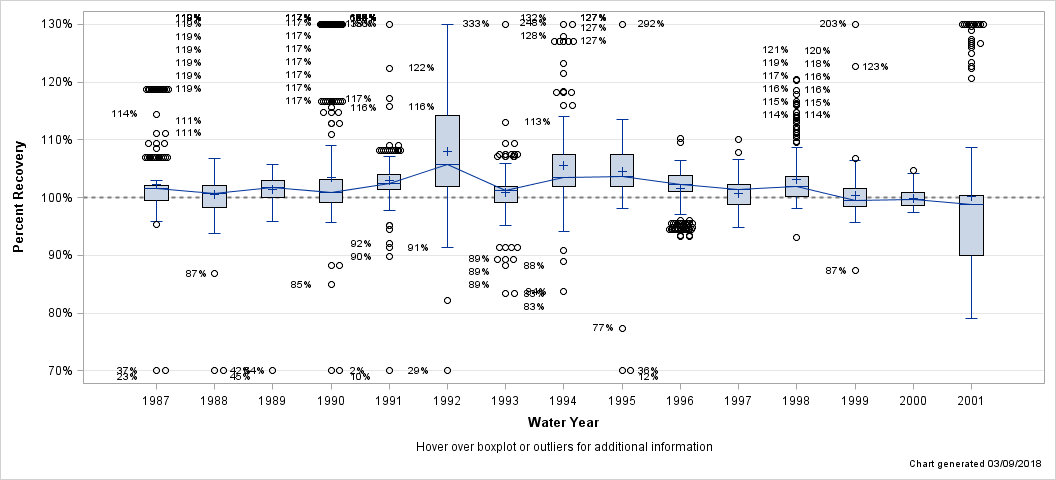
| - Acid Neutralizing Capacity (ANC; as CaCO3), UNF, TITR - |
| Lab: NWQL, PCode: 90410, MCode: TT040 |
| Login Dates: 10/14/86 through 09/27/01 |
| Open Data Set |
| Boxplot Description |

| Percent Recovery Statistics for Acid Neutralizing Capacity (ANC; as CaCO3), UNF, TITR |
| Analyte | Parm-meth Code | Water Year | # of Samples |
25th Pctl | 50th Pctl (Median) |
75th Pctl |
|---|---|---|---|---|---|---|
| Acid Neutralizing Capacity (ANC; as CaCO3), UNF, TITR | 90410TT040 | 1987 | 198 | 99.5% | 101.6% | 102.0% |
| 1988 | 271 | 98.3% | 100.8% | 102.0% | ||
| 1989 | 254 | 100.0% | 101.7% | 103.0% | ||
| 1990 | 285 | 99.1% | 100.8% | 103.2% | ||
| 1991 | 265 | 101.4% | 102.4% | 104.0% | ||
| 1992 | 247 | 101.9% | 105.7% | 114.3% | ||
| 1993 | 245 | 99.2% | 101.2% | 101.9% | ||
| 1994 | 245 | 102.0% | 103.4% | 107.4% | ||
| 1995 | 234 | 101.8% | 103.7% | 107.4% | ||
| 1996 | 224 | 101.0% | 102.3% | 103.9% | ||
| 1997 | 240 | 98.8% | 101.4% | 102.2% | ||
| 1998 | 240 | 100.3% | 102.0% | 103.7% | ||
| 1999 | 239 | 98.4% | 99.5% | 101.6% | ||
| 2000 | 60 | 98.5% | 99.6% | 100.9% | ||
| 2001 | 127 | 89.9% | 98.7% | 100.3% |
| Hover over boxplot or outliers for additional information |
| Chart generated 03/09/2018 |
| - Alkalinity (as CaCO3), FIL, TITR - |
| Lab: NWQL, PCode: 29801, MCode: TT040 |
| Login Dates: 10/05/99 through 09/27/01 |
| Open Data Set |
| Boxplot Description |
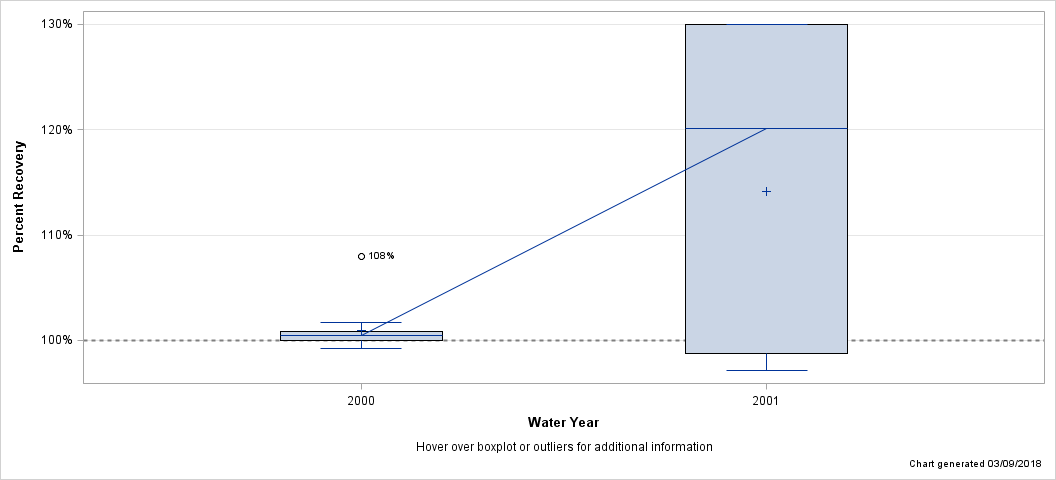
| Percent Recovery Statistics for Alkalinity (as CaCO3), FIL, TITR |
| Analyte | Parm-meth Code | Water Year | # of Samples |
25th Pctl | 50th Pctl (Median) |
75th Pctl |
|---|---|---|---|---|---|---|
| Alkalinity (as CaCO3), FIL, TITR | 29801TT040 | 2000 | 14 | 100.0% | 100.4% | 100.8% |
| 2001 | 32 | 98.7% | 120.2% | 131.0% |
| Hover over boxplot or outliers for additional information |
| Chart generated 03/09/2018 |
| - Calcium, FIL, AA - |
| Lab: NWQL, PCode: 00915, MCode: AA008 |
| Login Dates: 10/15/86 through 03/29/96 |
| Open Data Set |
| Boxplot Description |
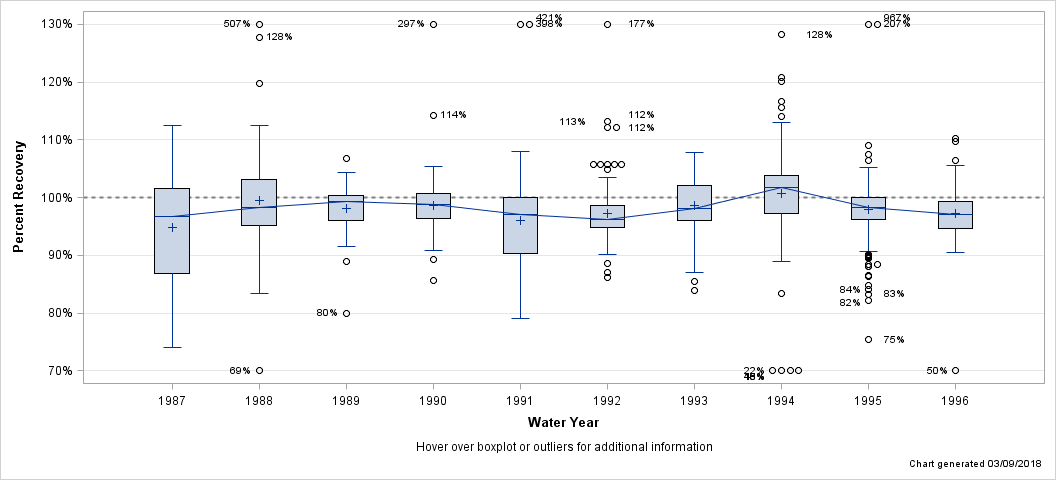
| Percent Recovery Statistics for Calcium, FIL, AA |
| Analyte | Parm-meth Code | Water Year | # of Samples |
25th Pctl | 50th Pctl (Median) |
75th Pctl |
|---|---|---|---|---|---|---|
| Calcium, FIL, AA | 00915AA008 | 1987 | 51 | 86.8% | 96.7% | 101.6% |
| 1988 | 84 | 95.2% | 98.3% | 103.2% | ||
| 1989 | 36 | 96.1% | 99.2% | 100.3% | ||
| 1990 | 138 | 96.4% | 98.8% | 100.6% | ||
| 1991 | 103 | 90.3% | 97.0% | 100.0% | ||
| 1992 | 121 | 94.8% | 96.2% | 98.7% | ||
| 1993 | 146 | 96.0% | 98.0% | 102.2% | ||
| 1994 | 125 | 97.3% | 101.8% | 103.8% | ||
| 1995 | 233 | 96.2% | 98.2% | 100.1% | ||
| 1996 | 63 | 94.6% | 97.0% | 99.3% |
| Hover over boxplot or outliers for additional information |
| Chart generated 03/09/2018 |
| - Calcium, FIL, AA, LL - |
| Lab: NWQL, PCode: 00915, MCode: AA007 |
| Login Dates: 10/09/86 through 07/24/96 |
| Open Data Set |
| Boxplot Description |
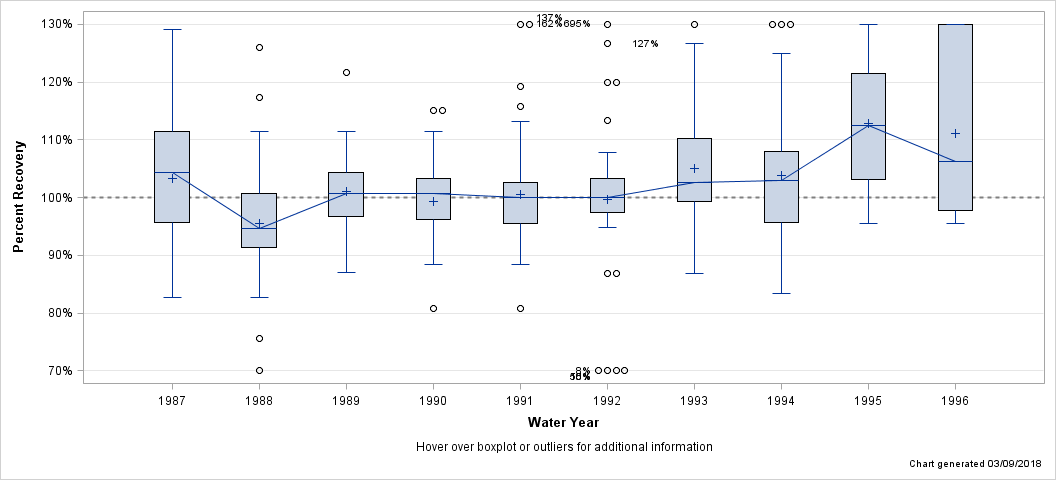
| Percent Recovery Statistics for Calcium, FIL, AA, LL |
| Analyte | Parm-meth Code | Water Year | # of Samples |
25th Pctl | 50th Pctl (Median) |
75th Pctl |
|---|---|---|---|---|---|---|
| Calcium, FIL, AA, LL | 00915AA007 | 1987 | 27 | 95.7% | 104.3% | 111.5% |
| 1988 | 34 | 91.3% | 94.6% | 100.7% | ||
| 1989 | 38 | 96.7% | 100.7% | 104.4% | ||
| 1990 | 55 | 96.2% | 100.7% | 103.3% | ||
| 1991 | 52 | 95.4% | 100.0% | 102.6% | ||
| 1992 | 69 | 97.4% | 100.0% | 103.3% | ||
| 1993 | 60 | 99.3% | 102.6% | 110.3% | ||
| 1994 | 36 | 95.7% | 103.0% | 108.0% | ||
| 1995 | 24 | 103.2% | 112.5% | 121.5% | ||
| 1996 | 19 | 97.8% | 106.2% | 132.7% |
| Hover over boxplot or outliers for additional information |
| Chart generated 03/09/2018 |
| - Calcium, FIL, ICP-OES - |
| Lab: NWQL, PCode: 00915, MCode: PLA11 |
| Login Dates: 10/14/86 through 09/27/01 |
| Open Data Set |
| Boxplot Description |
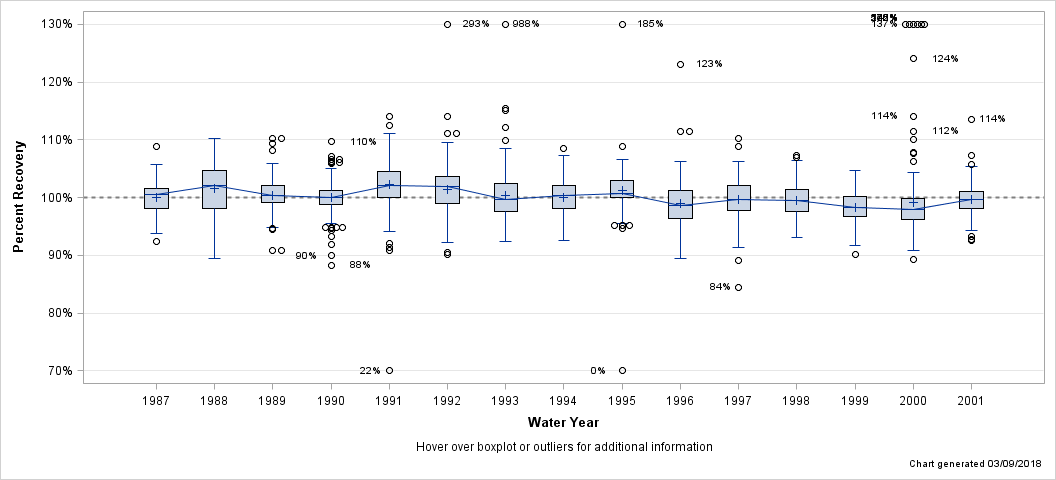
| Percent Recovery Statistics for Calcium, FIL, ICP-OES |
| Analyte | Parm-meth Code | Water Year | # of Samples |
25th Pctl | 50th Pctl (Median) |
75th Pctl |
|---|---|---|---|---|---|---|
| Calcium, FIL, ICP-OES | 00915PLA11 | 1987 | 150 | 98.1% | 100.6% | 101.6% |
| 1988 | 175 | 98.0% | 102.1% | 104.6% | ||
| 1989 | 218 | 99.2% | 100.4% | 102.1% | ||
| 1990 | 340 | 98.8% | 100.0% | 101.3% | ||
| 1991 | 352 | 100.0% | 102.1% | 104.5% | ||
| 1992 | 379 | 98.9% | 101.9% | 103.6% | ||
| 1993 | 350 | 97.6% | 99.7% | 102.4% | ||
| 1994 | 372 | 98.1% | 100.3% | 102.1% | ||
| 1995 | 232 | 99.9% | 100.7% | 103.0% | ||
| 1996 | 339 | 96.3% | 98.6% | 101.2% | ||
| 1997 | 240 | 97.7% | 99.7% | 102.0% | ||
| 1998 | 240 | 97.7% | 99.4% | 101.3% | ||
| 1999 | 237 | 96.8% | 98.3% | 100.1% | ||
| 2000 | 238 | 96.2% | 97.9% | 99.8% | ||
| 2001 | 197 | 98.1% | 99.7% | 101.0% |
| Hover over boxplot or outliers for additional information |
| Chart generated 03/09/2018 |
| - Calcium, FIL, ICP-OES, LL - |
| Lab: NWQL, PCode: 00915, MCode: PLA09 |
| Login Dates: 10/08/92 through 09/26/96 |
| Open Data Set |
| Boxplot Description |
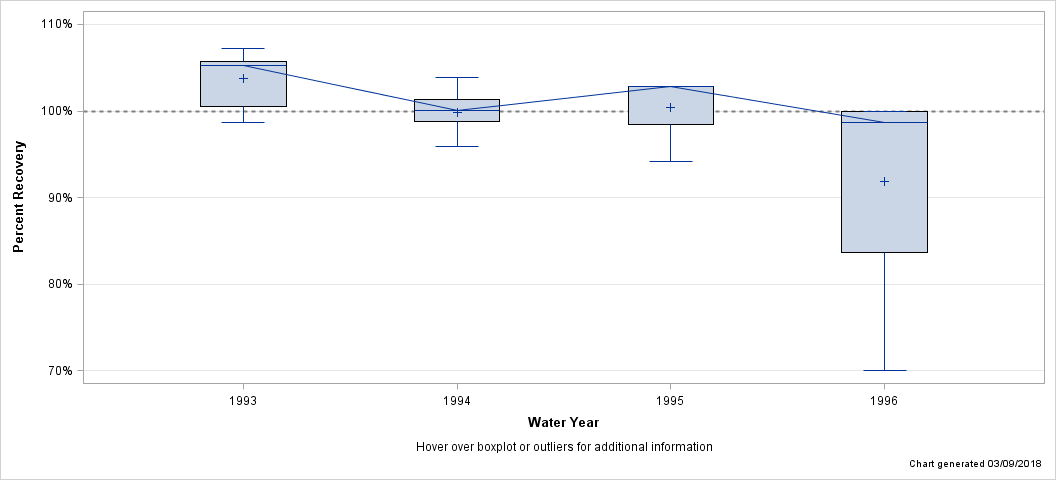
| Percent Recovery Statistics for Calcium, FIL, ICP-OES, LL |
| Analyte | Parm-meth Code | Water Year | # of Samples |
25th Pctl | 50th Pctl (Median) |
75th Pctl |
|---|---|---|---|---|---|---|
| Calcium, FIL, ICP-OES, LL | 00915PLA09 | 1993 | 24 | 100.6% | 105.3% | 105.8% |
| 1994 | 24 | 98.8% | 100.1% | 101.3% | ||
| 1995 | 11 | 98.5% | 102.8% | 102.8% | ||
| 1996 | 4 | 58.7% | 98.7% | 100.0% |
| Hover over boxplot or outliers for additional information |
| Chart generated 03/09/2018 |
| - Calcium, UNF, ICP-OES - |
| Lab: NWQL, PCode: 00916, MCode: PLA15 |
| Login Dates: 10/14/99 through 09/14/01 |
| Open Data Set |
| Boxplot Description |
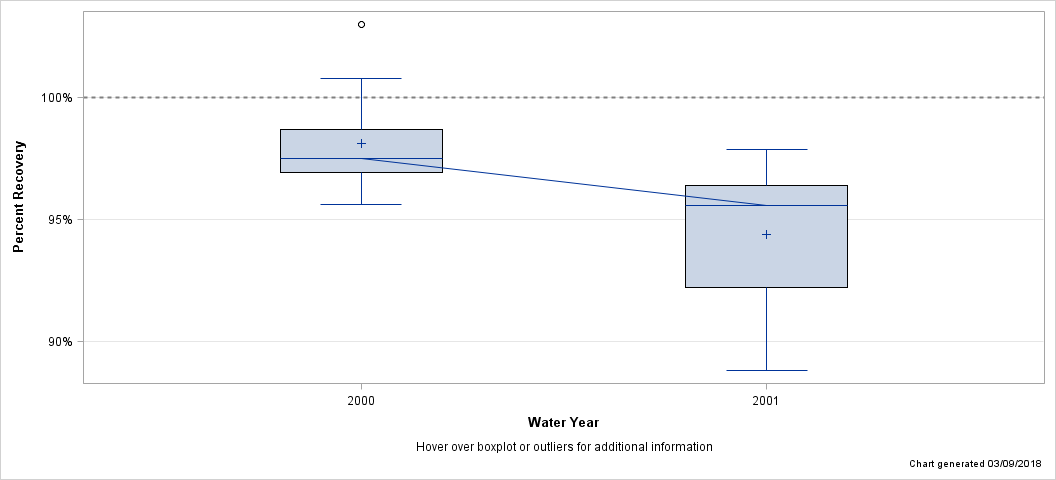
| Percent Recovery Statistics for Calcium, UNF, ICP-OES |
| Analyte | Parm-meth Code | Water Year | # of Samples |
25th Pctl | 50th Pctl (Median) |
75th Pctl |
|---|---|---|---|---|---|---|
| Calcium, UNF, ICP-OES | 00916PLA15 | 2000 | 11 | 97.0% | 97.5% | 98.7% |
| 2001 | 12 | 92.2% | 95.6% | 96.4% |
| Hover over boxplot or outliers for additional information |
| Chart generated 03/09/2018 |
| - Chloride, FIL - |
| Lab: NWQL, PCode: 00940, MCode: ADF02 |
| Login Dates: 10/14/86 through 12/07/87 |
| Open Data Set |
| Boxplot Description |
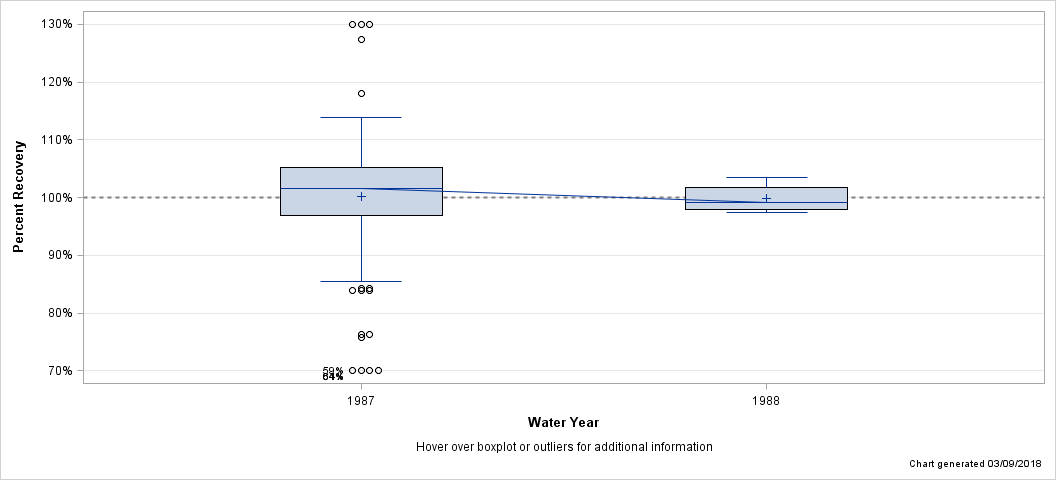
| Percent Recovery Statistics for Chloride, FIL |
| Analyte | Parm-meth Code | Water Year | # of Samples |
25th Pctl | 50th Pctl (Median) |
75th Pctl |
|---|---|---|---|---|---|---|
| Chloride, FIL | 00940ADF02 | 1987 | 177 | 96.9% | 101.5% | 105.3% |
| 1988 | 4 | 97.9% | 99.2% | 101.7% |
| Hover over boxplot or outliers for additional information |
| Chart generated 03/09/2018 |
| - Chloride, FIL - |
| Lab: NWQL, PCode: 00940, MCode: CL031 |
| Login Dates: 05/28/87 through 12/23/93 |
| Open Data Set |
| Boxplot Description |
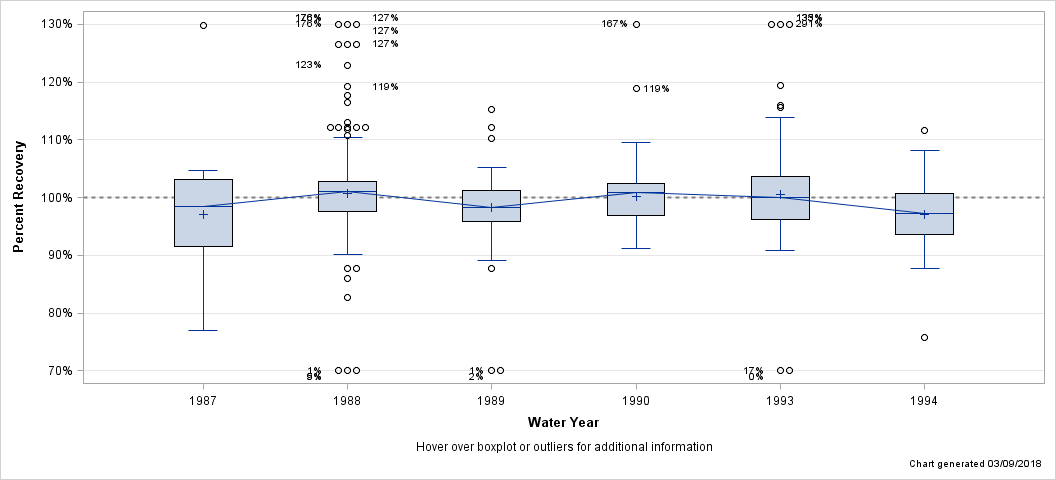
| Percent Recovery Statistics for Chloride, FIL |
| Analyte | Parm-meth Code | Water Year | # of Samples |
25th Pctl | 50th Pctl (Median) |
75th Pctl |
|---|---|---|---|---|---|---|
| Chloride, FIL | 00940CL031 | 1987 | 39 | 91.6% | 98.5% | 103.1% |
| 1988 | 270 | 97.7% | 101.0% | 102.8% | ||
| 1989 | 254 | 95.9% | 98.3% | 101.2% | ||
| 1990 | 128 | 96.9% | 100.9% | 102.4% | ||
| 1993 | 238 | 96.3% | 100.0% | 103.6% | ||
| 1994 | 55 | 93.5% | 97.3% | 100.7% |
| Hover over boxplot or outliers for additional information |
| Chart generated 03/09/2018 |
| - Chloride, FIL - |
| Lab: NWQL, PCode: 00940, MCode: IC010 |
| Login Dates: 10/08/91 through 01/29/92 |
| Open Data Set |
| Boxplot Description |
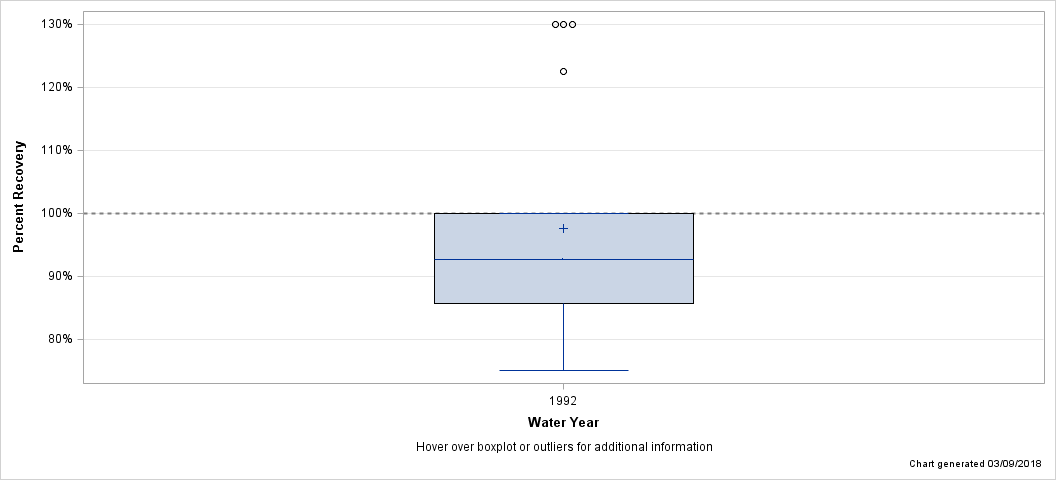
| Percent Recovery Statistics for Chloride, FIL |
| Analyte | Parm-meth Code | Water Year | # of Samples |
25th Pctl | 50th Pctl (Median) |
75th Pctl |
|---|---|---|---|---|---|---|
| Chloride, FIL | 00940IC010 | 1992 | 18 | 85.7% | 92.6% | 100.0% |
| Hover over boxplot or outliers for additional information |
| Chart generated 03/09/2018 |
| - Chloride, FIL, IC - |
| Lab: NWQL, PCode: 00940, MCode: IC022 |
| Login Dates: 02/28/90 through 09/27/01 |
| Open Data Set |
| Boxplot Description |
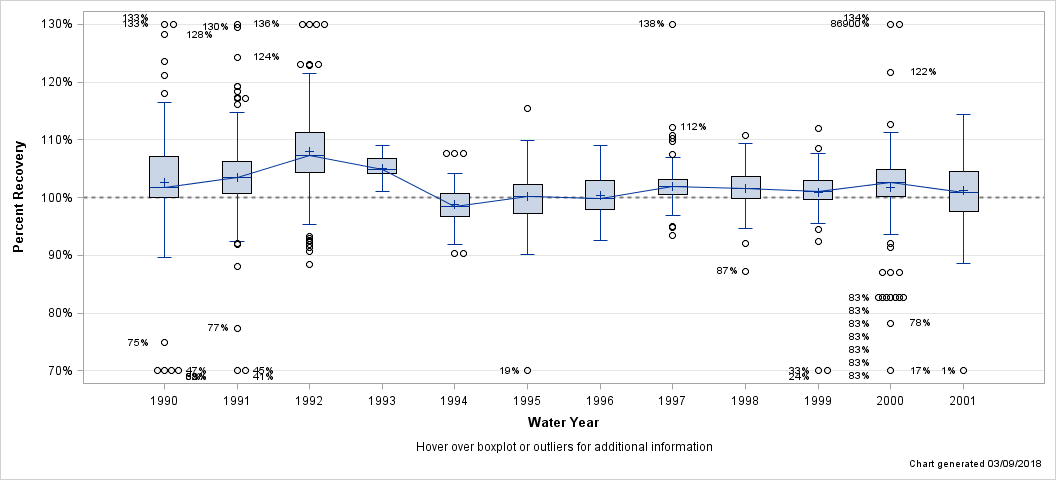
| Percent Recovery Statistics for Chloride, FIL, IC |
| Analyte | Parm-meth Code | Water Year | # of Samples |
25th Pctl | 50th Pctl (Median) |
75th Pctl |
|---|---|---|---|---|---|---|
| Chloride, FIL, IC | 00940IC022 | 1990 | 168 | 100.0% | 101.7% | 107.0% |
| 1991 | 265 | 100.6% | 103.5% | 106.3% | ||
| 1992 | 247 | 104.3% | 107.2% | 111.4% | ||
| 1993 | 6 | 104.1% | 104.9% | 106.7% | ||
| 1994 | 190 | 96.8% | 98.5% | 100.7% | ||
| 1995 | 234 | 97.2% | 100.2% | 102.3% | ||
| 1996 | 225 | 97.9% | 99.8% | 102.9% | ||
| 1997 | 241 | 100.5% | 101.9% | 103.1% | ||
| 1998 | 240 | 99.8% | 101.6% | 103.6% | ||
| 1999 | 237 | 99.6% | 101.1% | 102.9% | ||
| 2000 | 239 | 100.1% | 102.6% | 104.8% | ||
| 2001 | 177 | 97.6% | 101.0% | 104.5% |
| Hover over boxplot or outliers for additional information |
| Chart generated 03/09/2018 |
| - Chloride, FIL, IC, LL - |
| Lab: NWQL, PCode: 00940, MCode: IC024 |
| Login Dates: 10/09/86 through 09/28/01 |
| Open Data Set |
| Boxplot Description |
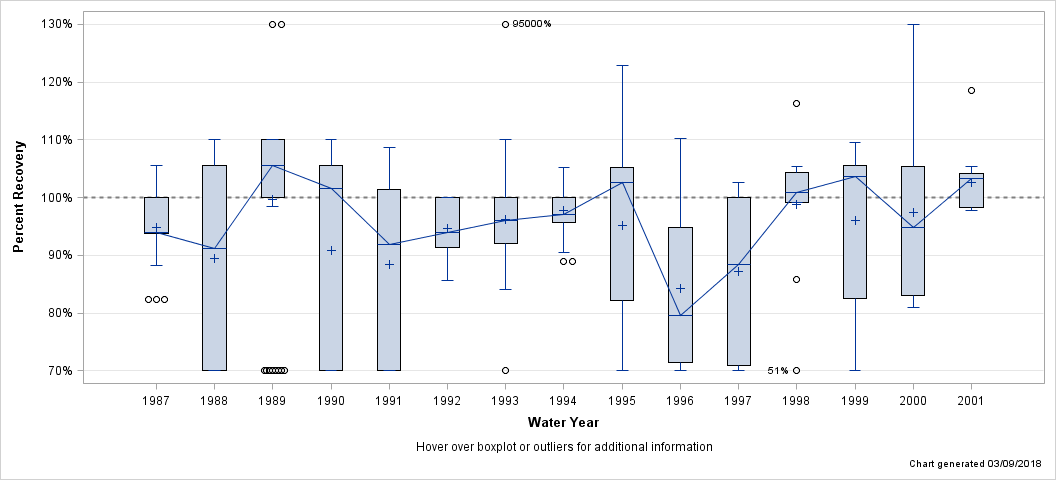
| Percent Recovery Statistics for Chloride, FIL, IC, LL |
| Analyte | Parm-meth Code | Water Year | # of Samples |
25th Pctl | 50th Pctl (Median) |
75th Pctl |
|---|---|---|---|---|---|---|
| Chloride, FIL, IC, LL | 00940IC024 | 1987 | 22 | 93.8% | 93.9% | 100.0% |
| 1988 | 30 | 52.9% | 91.2% | 105.5% | ||
| 1989 | 38 | 100.0% | 105.5% | 110.1% | ||
| 1990 | 54 | 66.7% | 101.5% | 105.5% | ||
| 1991 | 52 | 66.7% | 91.8% | 101.4% | ||
| 1992 | 51 | 91.3% | 93.9% | 100.0% | ||
| 1993 | 60 | 92.0% | 96.0% | 100.0% | ||
| 1994 | 35 | 95.7% | 97.0% | 100.0% | ||
| 1995 | 24 | 82.1% | 102.6% | 105.3% | ||
| 1996 | 22 | 71.4% | 79.6% | 94.9% | ||
| 1997 | 23 | 71.0% | 88.4% | 100.0% | ||
| 1998 | 11 | 99.1% | 100.8% | 104.3% | ||
| 1999 | 12 | 82.5% | 103.7% | 105.5% | ||
| 2000 | 12 | 83.0% | 94.8% | 105.4% | ||
| 2001 | 20 | 98.2% | 103.4% | 104.1% |
| Hover over boxplot or outliers for additional information |
| Chart generated 03/09/2018 |
| - Fluoride, FIL, IC - |
| Lab: NWQL, PCode: 00950, MCode: IC021 |
| Login Dates: 01/22/90 through 12/23/93 |
| Open Data Set |
| Boxplot Description |
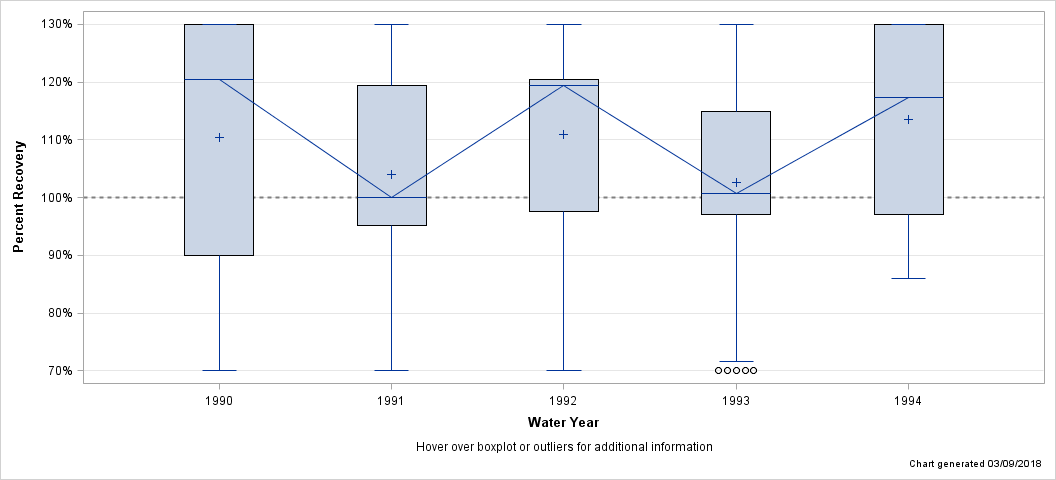
| Percent Recovery Statistics for Fluoride, FIL, IC |
| Analyte | Parm-meth Code | Water Year | # of Samples |
25th Pctl | 50th Pctl (Median) |
75th Pctl |
|---|---|---|---|---|---|---|
| Fluoride, FIL, IC | 00950IC021 | 1990 | 157 | 90.0% | 120.5% | 232.6% |
| 1991 | 265 | 95.2% | 100.0% | 119.4% | ||
| 1992 | 169 | 97.6% | 119.4% | 120.5% | ||
| 1993 | 243 | 97.1% | 100.7% | 114.9% | ||
| 1994 | 52 | 97.1% | 117.4% | 138.6% |
| Hover over boxplot or outliers for additional information |
| Chart generated 03/09/2018 |
| - Fluoride, FIL, IC, LL - |
| Lab: NWQL, PCode: 00950, MCode: IC024 |
| Login Dates: 10/09/86 through 09/28/01 |
| Open Data Set |
| Boxplot Description |
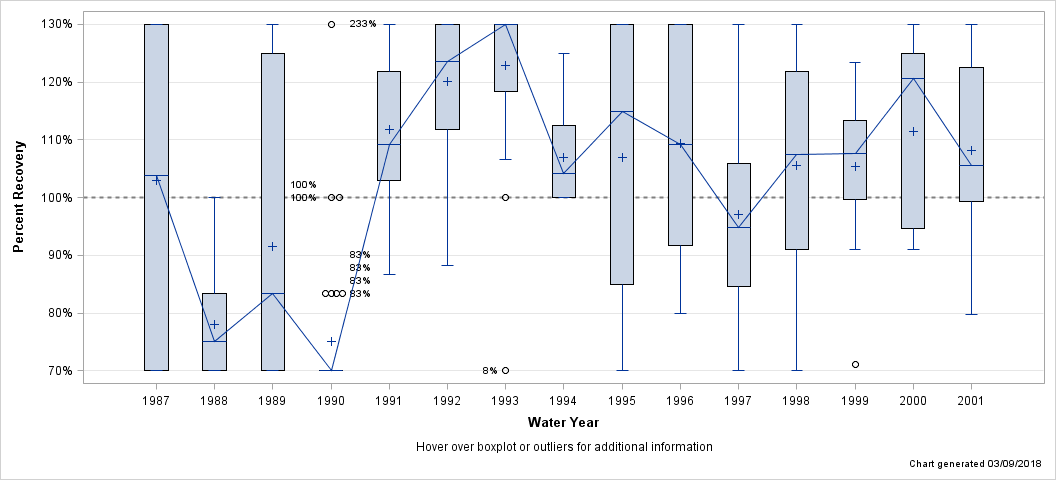
| Percent Recovery Statistics for Fluoride, FIL, IC, LL |
| Analyte | Parm-meth Code | Water Year | # of Samples |
25th Pctl | 50th Pctl (Median) |
75th Pctl |
|---|---|---|---|---|---|---|
| Fluoride, FIL, IC, LL | 00950IC024 | 1987 | 22 | 66.7% | 103.8% | 150.0% |
| 1988 | 25 | 66.7% | 75.0% | 83.3% | ||
| 1989 | 38 | 37.5% | 83.3% | 125.0% | ||
| 1990 | 34 | 25.0% | 50.0% | 66.7% | ||
| 1991 | 28 | 102.9% | 109.2% | 121.8% | ||
| 1992 | 55 | 111.8% | 123.5% | 133.3% | ||
| 1993 | 32 | 118.3% | 133.3% | 144.2% | ||
| 1994 | 12 | 100.0% | 104.2% | 112.5% | ||
| 1995 | 16 | 85.0% | 125.0% | 300.0% | ||
| 1996 | 22 | 91.7% | 109.2% | 266.7% | ||
| 1997 | 24 | 84.7% | 94.8% | 105.8% | ||
| 1998 | 12 | 91.0% | 107.6% | 121.8% | ||
| 1999 | 12 | 99.6% | 107.6% | 113.3% | ||
| 2000 | 11 | 94.7% | 120.6% | 125.0% | ||
| 2001 | 20 | 99.3% | 105.6% | 122.6% |
| Hover over boxplot or outliers for additional information |
| Chart generated 03/09/2018 |
| - Fluoride, FIL, ISE - |
| Lab: NWQL, PCode: 00950, MCode: ISE05 |
| Login Dates: 10/14/86 through 09/27/01 |
| Open Data Set |
| Boxplot Description |
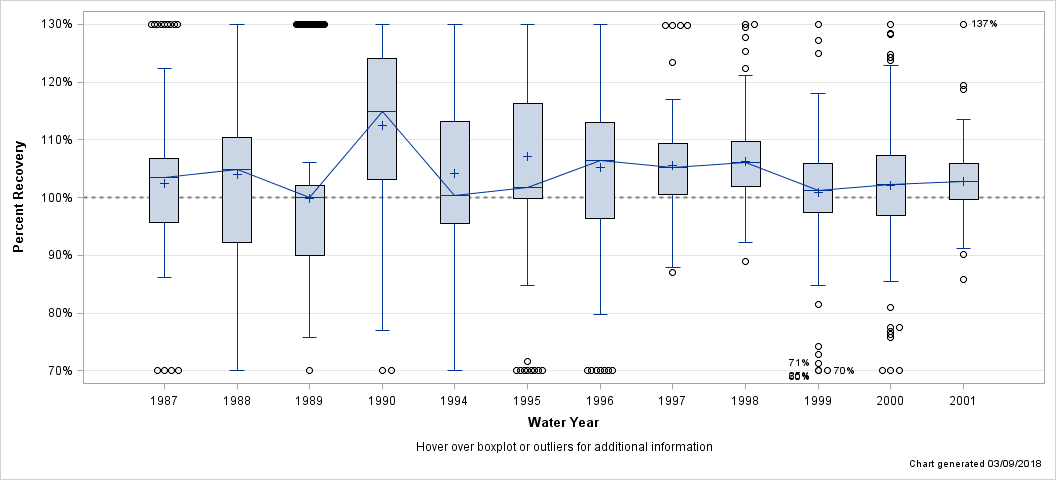
| Percent Recovery Statistics for Fluoride, FIL, ISE |
| Analyte | Parm-meth Code | Water Year | # of Samples |
25th Pctl | 50th Pctl (Median) |
75th Pctl |
|---|---|---|---|---|---|---|
| Fluoride, FIL, ISE | 00950ISE05 | 1987 | 216 | 95.7% | 103.4% | 106.8% |
| 1988 | 271 | 92.2% | 104.9% | 110.4% | ||
| 1989 | 161 | 90.0% | 100.0% | 102.0% | ||
| 1990 | 125 | 103.1% | 114.9% | 124.2% | ||
| 1994 | 193 | 95.5% | 100.4% | 113.1% | ||
| 1995 | 234 | 99.8% | 101.7% | 116.3% | ||
| 1996 | 225 | 96.4% | 106.4% | 113.0% | ||
| 1997 | 240 | 100.6% | 105.3% | 109.3% | ||
| 1998 | 235 | 101.9% | 106.0% | 109.7% | ||
| 1999 | 208 | 97.4% | 101.2% | 105.9% | ||
| 2000 | 241 | 96.9% | 102.3% | 107.3% | ||
| 2001 | 239 | 99.7% | 102.8% | 106.0% |
| Hover over boxplot or outliers for additional information |
| Chart generated 03/09/2018 |
| - Magnesium, FIL, AA - |
| Lab: NWQL, PCode: 00925, MCode: AA022 |
| Login Dates: 10/15/86 through 03/29/96 |
| Open Data Set |
| Boxplot Description |
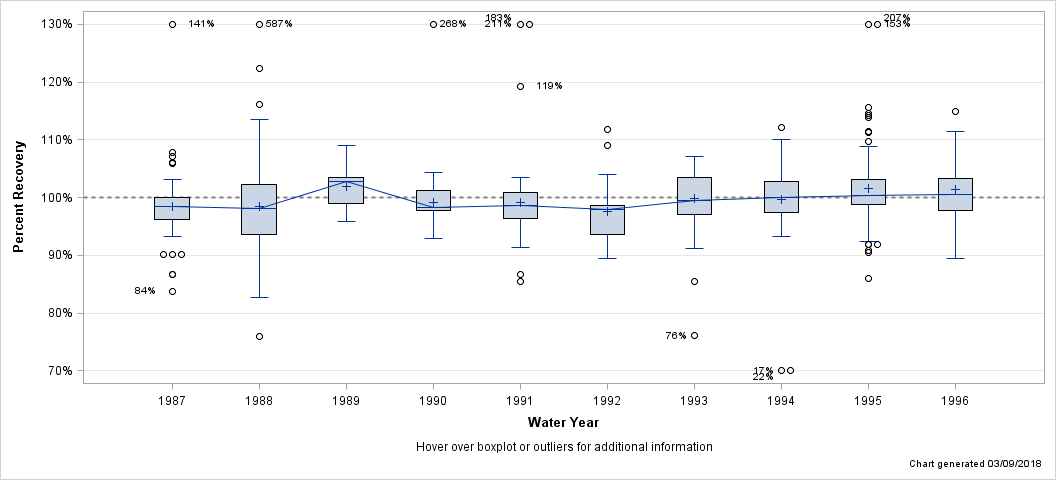
| Percent Recovery Statistics for Magnesium, FIL, AA |
| Analyte | Parm-meth Code | Water Year | # of Samples |
25th Pctl | 50th Pctl (Median) |
75th Pctl |
|---|---|---|---|---|---|---|
| Magnesium, FIL, AA | 00925AA022 | 1987 | 51 | 96.2% | 98.4% | 100.0% |
| 1988 | 84 | 93.6% | 98.1% | 102.3% | ||
| 1989 | 36 | 99.1% | 102.8% | 103.6% | ||
| 1990 | 138 | 97.7% | 98.4% | 101.2% | ||
| 1991 | 103 | 96.4% | 98.7% | 100.9% | ||
| 1992 | 49 | 93.6% | 97.9% | 98.7% | ||
| 1993 | 75 | 97.1% | 99.4% | 103.4% | ||
| 1994 | 55 | 97.4% | 100.0% | 102.7% | ||
| 1995 | 162 | 98.8% | 100.4% | 103.2% | ||
| 1996 | 33 | 97.7% | 100.5% | 103.3% |
| Hover over boxplot or outliers for additional information |
| Chart generated 03/09/2018 |
| - Magnesium, FIL, AA, LL - |
| Lab: NWQL, PCode: 00925, MCode: AA023 |
| Login Dates: 10/09/86 through 07/24/96 |
| Open Data Set |
| Boxplot Description |
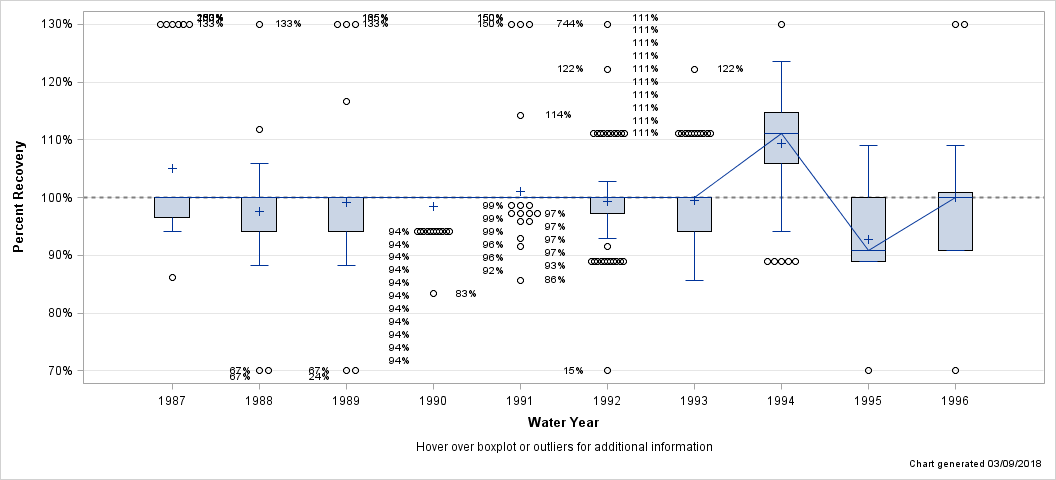
| Percent Recovery Statistics for Magnesium, FIL, AA, LL |
| Analyte | Parm-meth Code | Water Year | # of Samples |
25th Pctl | 50th Pctl (Median) |
75th Pctl |
|---|---|---|---|---|---|---|
| Magnesium, FIL, AA, LL | 00925AA023 | 1987 | 27 | 96.6% | 100.0% | 100.0% |
| 1988 | 34 | 94.1% | 100.0% | 100.0% | ||
| 1989 | 38 | 94.1% | 100.0% | 100.0% | ||
| 1990 | 53 | 100.0% | 100.0% | 100.0% | ||
| 1991 | 52 | 100.0% | 100.0% | 100.0% | ||
| 1992 | 69 | 97.2% | 100.0% | 100.0% | ||
| 1993 | 60 | 94.1% | 100.0% | 100.0% | ||
| 1994 | 36 | 105.9% | 111.1% | 114.7% | ||
| 1995 | 24 | 88.9% | 90.9% | 100.0% | ||
| 1996 | 19 | 90.9% | 100.0% | 100.9% |
| Hover over boxplot or outliers for additional information |
| Chart generated 03/09/2018 |
| - Magnesium, FIL, ICP-OES - |
| Lab: NWQL, PCode: 00925, MCode: PLA11 |
| Login Dates: 10/14/86 through 09/27/01 |
| Open Data Set |
| Boxplot Description |
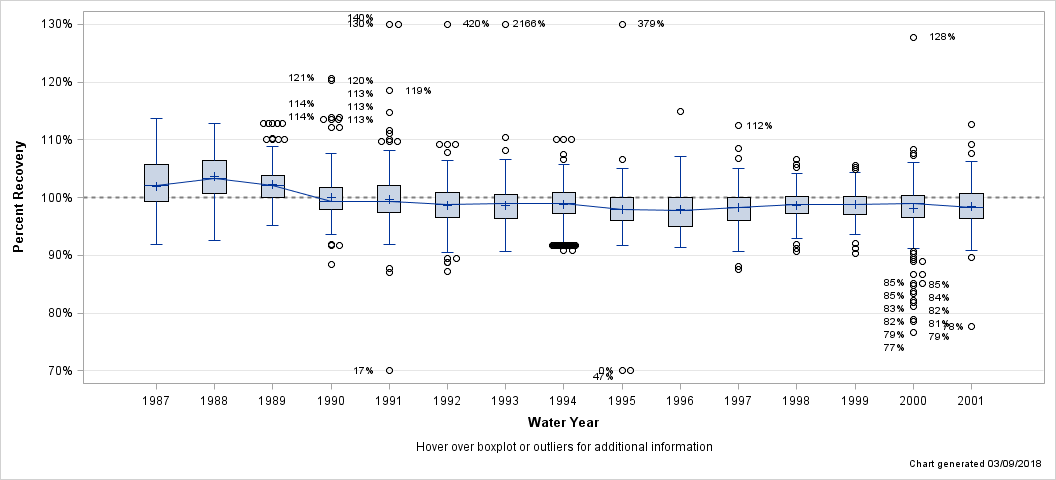
| Percent Recovery Statistics for Magnesium, FIL, ICP-OES |
| Analyte | Parm-meth Code | Water Year | # of Samples |
25th Pctl | 50th Pctl (Median) |
75th Pctl |
|---|---|---|---|---|---|---|
| Magnesium, FIL, ICP-OES | 00925PLA11 | 1987 | 150 | 99.4% | 102.0% | 105.8% |
| 1988 | 175 | 100.7% | 103.2% | 106.4% | ||
| 1989 | 218 | 100.0% | 102.0% | 103.9% | ||
| 1990 | 337 | 98.0% | 99.3% | 101.8% | ||
| 1991 | 352 | 97.5% | 99.4% | 102.2% | ||
| 1992 | 379 | 96.5% | 98.8% | 100.9% | ||
| 1993 | 350 | 96.4% | 99.0% | 100.5% | ||
| 1994 | 372 | 97.3% | 98.9% | 100.9% | ||
| 1995 | 232 | 96.0% | 98.0% | 100.0% | ||
| 1996 | 306 | 95.0% | 97.7% | 100.0% | ||
| 1997 | 240 | 96.0% | 98.3% | 100.1% | ||
| 1998 | 240 | 97.3% | 98.8% | 100.2% | ||
| 1999 | 237 | 97.1% | 98.7% | 100.2% | ||
| 2000 | 238 | 96.6% | 98.9% | 100.4% | ||
| 2001 | 197 | 96.4% | 98.2% | 100.8% |
| Hover over boxplot or outliers for additional information |
| Chart generated 03/09/2018 |
| - Magnesium, FIL, ICP-OES, LL - |
| Lab: NWQL, PCode: 00925, MCode: PLA09 |
| Login Dates: 10/08/92 through 01/31/97 |
| Open Data Set |
| Boxplot Description |
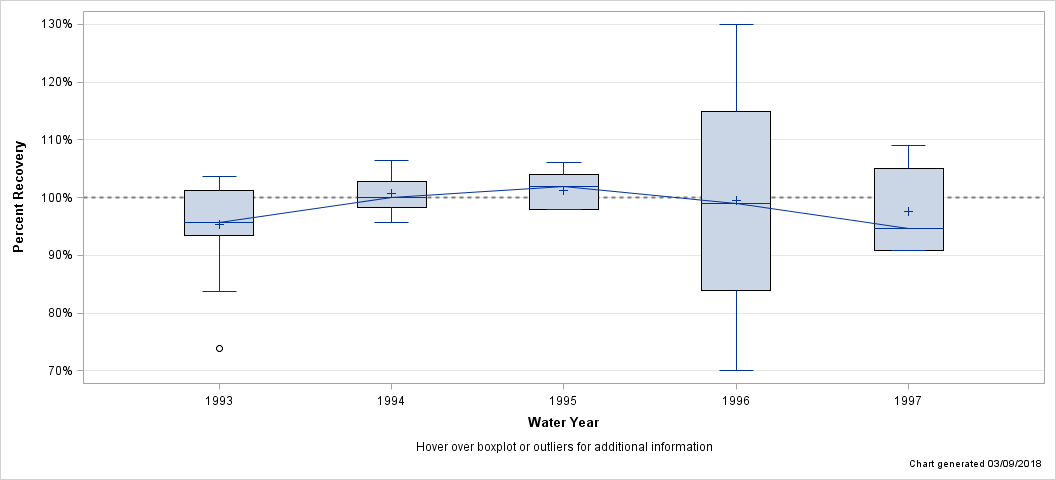
| Percent Recovery Statistics for Magnesium, FIL, ICP-OES, LL |
| Analyte | Parm-meth Code | Water Year | # of Samples |
25th Pctl | 50th Pctl (Median) |
75th Pctl |
|---|---|---|---|---|---|---|
| Magnesium, FIL, ICP-OES, LL | 00925PLA09 | 1993 | 24 | 93.4% | 95.6% | 101.2% |
| 1994 | 24 | 98.3% | 100.0% | 102.8% | ||
| 1995 | 11 | 98.0% | 102.0% | 104.0% | ||
| 1996 | 4 | 67.1% | 98.9% | 522.7% | ||
| 1997 | 8 | 90.9% | 94.6% | 105.0% |
| Hover over boxplot or outliers for additional information |
| Chart generated 03/09/2018 |
| - Magnesium, UNF, ICP-OES - |
| Lab: NWQL, PCode: 00927, MCode: PLA15 |
| Login Dates: 10/14/99 through 09/14/01 |
| Open Data Set |
| Boxplot Description |
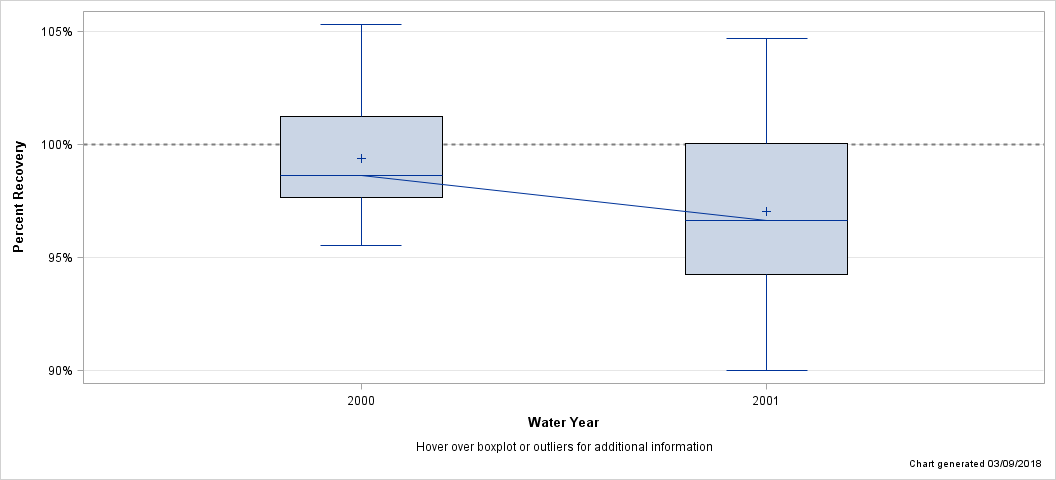
| Percent Recovery Statistics for Magnesium, UNF, ICP-OES |
| Analyte | Parm-meth Code | Water Year | # of Samples |
25th Pctl | 50th Pctl (Median) |
75th Pctl |
|---|---|---|---|---|---|---|
| Magnesium, UNF, ICP-OES | 00927PLA15 | 2000 | 11 | 97.7% | 98.6% | 101.3% |
| 2001 | 12 | 94.3% | 96.7% | 100.1% |
| Hover over boxplot or outliers for additional information |
| Chart generated 03/09/2018 |
| - Potassium, FIL, AA - |
| Lab: NWQL, PCode: 00935, MCode: AA030 |
| Login Dates: 10/14/86 through 09/27/01 |
| Open Data Set |
| Boxplot Description |
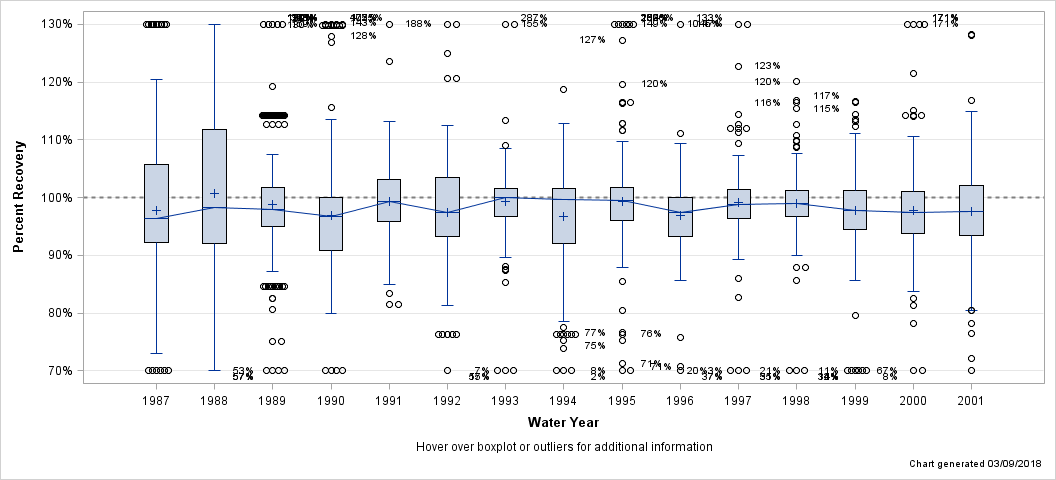
| Percent Recovery Statistics for Potassium, FIL, AA |
| Analyte | Parm-meth Code | Water Year | # of Samples |
25th Pctl | 50th Pctl (Median) |
75th Pctl |
|---|---|---|---|---|---|---|
| Potassium, FIL, AA | 00935AA030 | 1987 | 200 | 92.2% | 96.4% | 105.7% |
| 1988 | 258 | 92.1% | 98.2% | 111.8% | ||
| 1989 | 254 | 95.0% | 97.9% | 101.7% | ||
| 1990 | 283 | 90.9% | 96.7% | 100.0% | ||
| 1991 | 264 | 95.8% | 99.3% | 103.1% | ||
| 1992 | 247 | 93.3% | 97.4% | 103.4% | ||
| 1993 | 245 | 96.7% | 100.0% | 101.5% | ||
| 1994 | 245 | 92.0% | 99.6% | 101.5% | ||
| 1995 | 234 | 96.0% | 99.5% | 101.8% | ||
| 1996 | 224 | 93.3% | 97.5% | 100.0% | ||
| 1997 | 240 | 96.3% | 98.9% | 101.4% | ||
| 1998 | 240 | 96.7% | 98.9% | 101.3% | ||
| 1999 | 242 | 94.5% | 97.8% | 101.3% | ||
| 2000 | 240 | 93.8% | 97.4% | 101.0% | ||
| 2001 | 238 | 93.5% | 97.6% | 102.2% |
| Hover over boxplot or outliers for additional information |
| Chart generated 03/09/2018 |
| - Potassium, FIL, AA, LL - |
| Lab: NWQL, PCode: 00935, MCode: AA031 |
| Login Dates: 10/09/86 through 09/28/01 |
| Open Data Set |
| Boxplot Description |
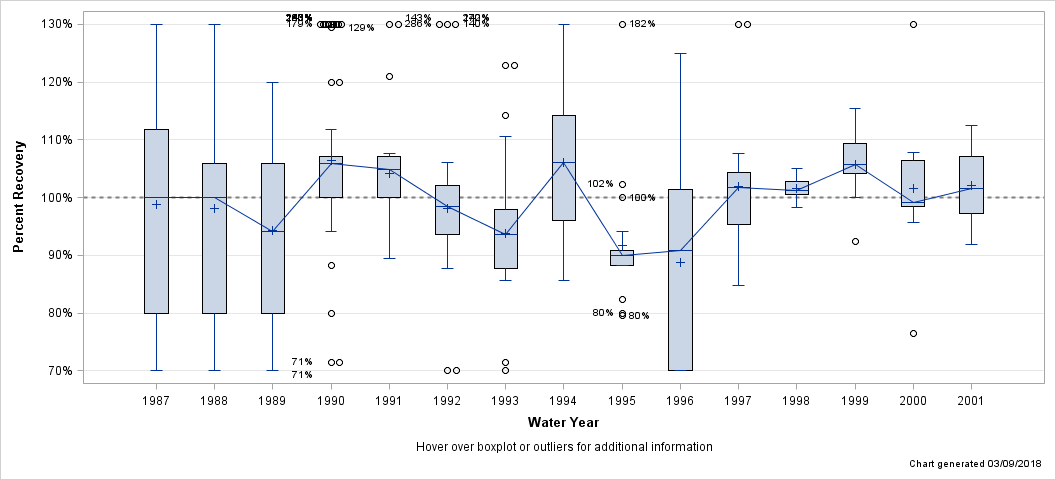
| Percent Recovery Statistics for Potassium, FIL, AA, LL |
| Analyte | Parm-meth Code | Water Year | # of Samples |
25th Pctl | 50th Pctl (Median) |
75th Pctl |
|---|---|---|---|---|---|---|
| Potassium, FIL, AA, LL | 00935AA031 | 1987 | 27 | 80.0% | 100.0% | 111.8% |
| 1988 | 34 | 80.0% | 100.0% | 105.9% | ||
| 1989 | 38 | 80.0% | 94.1% | 105.9% | ||
| 1990 | 57 | 100.0% | 105.9% | 107.1% | ||
| 1991 | 52 | 100.0% | 104.9% | 107.1% | ||
| 1992 | 69 | 93.6% | 98.5% | 102.1% | ||
| 1993 | 60 | 87.7% | 93.6% | 97.9% | ||
| 1994 | 36 | 96.0% | 106.1% | 114.3% | ||
| 1995 | 24 | 88.2% | 90.0% | 90.9% | ||
| 1996 | 23 | 10.0% | 90.9% | 101.4% | ||
| 1997 | 24 | 95.3% | 101.7% | 104.3% | ||
| 1998 | 12 | 100.6% | 101.2% | 102.7% | ||
| 1999 | 10 | 104.2% | 105.7% | 109.4% | ||
| 2000 | 9 | 98.5% | 99.2% | 106.5% | ||
| 2001 | 20 | 97.2% | 101.7% | 107.2% |
| Hover over boxplot or outliers for additional information |
| Chart generated 03/09/2018 |
| - Silica, FIL, CFA - |
| Lab: NWQL, PCode: 00955, MCode: CL064 |
| Login Dates: 10/14/86 through 09/27/01 |
| Open Data Set |
| Boxplot Description |
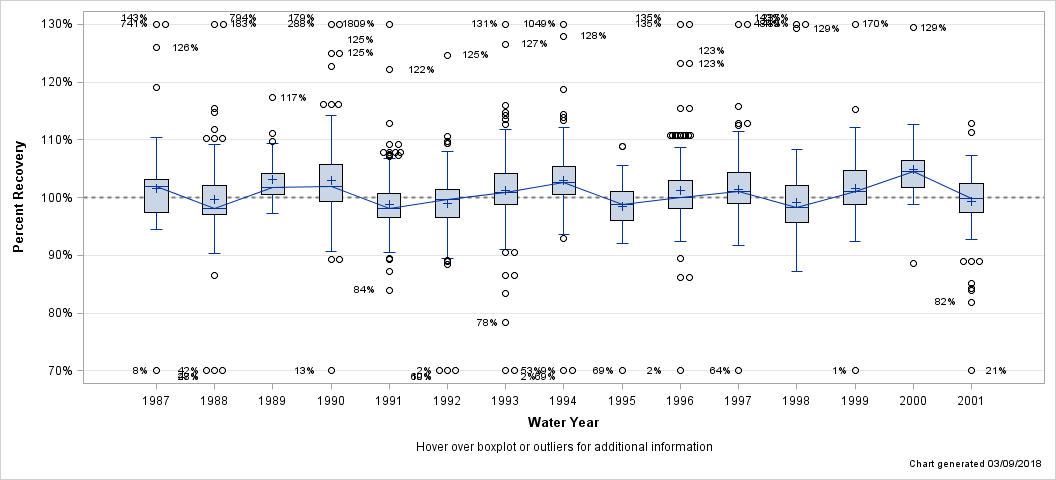
| Percent Recovery Statistics for Silica, FIL, CFA |
| Analyte | Parm-meth Code | Water Year | # of Samples |
25th Pctl | 50th Pctl (Median) |
75th Pctl |
|---|---|---|---|---|---|---|
| Silica, FIL, CFA | 00955CL064 | 1987 | 65 | 97.4% | 101.9% | 103.2% |
| 1988 | 96 | 97.1% | 98.0% | 102.0% | ||
| 1989 | 36 | 100.6% | 101.7% | 104.2% | ||
| 1990 | 164 | 99.3% | 101.9% | 105.7% | ||
| 1991 | 264 | 96.6% | 98.2% | 100.8% | ||
| 1992 | 319 | 96.5% | 99.6% | 101.4% | ||
| 1993 | 315 | 98.8% | 100.9% | 104.2% | ||
| 1994 | 315 | 100.5% | 102.7% | 105.4% | ||
| 1995 | 234 | 96.1% | 98.9% | 101.1% | ||
| 1996 | 220 | 98.1% | 100.0% | 103.0% | ||
| 1997 | 239 | 99.0% | 101.1% | 104.3% | ||
| 1998 | 119 | 95.6% | 98.2% | 102.0% | ||
| 1999 | 119 | 98.8% | 101.1% | 104.7% | ||
| 2000 | 48 | 101.7% | 104.6% | 106.4% | ||
| 2001 | 118 | 97.5% | 99.8% | 102.4% |
| Hover over boxplot or outliers for additional information |
| Chart generated 03/09/2018 |
| - Silica, FIL, ICP-OES - |
| Lab: NWQL, PCode: 00955, MCode: PLA11 |
| Login Dates: 10/14/86 through 09/27/01 |
| Open Data Set |
| Boxplot Description |
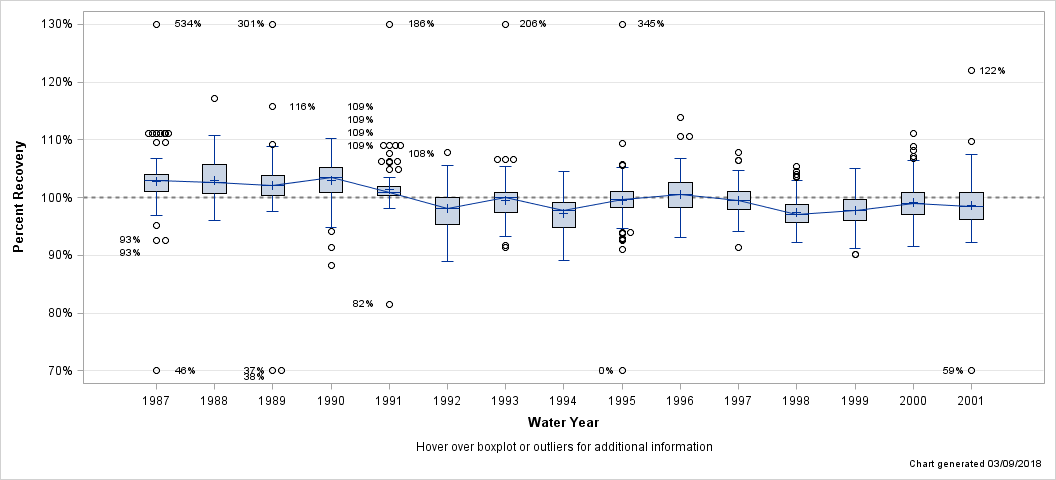
| Percent Recovery Statistics for Silica, FIL, ICP-OES |
| Analyte | Parm-meth Code | Water Year | # of Samples |
25th Pctl | 50th Pctl (Median) |
75th Pctl |
|---|---|---|---|---|---|---|
| Silica, FIL, ICP-OES | 00955PLA11 | 1987 | 150 | 101.1% | 102.9% | 103.9% |
| 1988 | 175 | 100.7% | 102.6% | 105.8% | ||
| 1989 | 218 | 100.4% | 102.0% | 103.9% | ||
| 1990 | 249 | 101.0% | 103.4% | 105.3% | ||
| 1991 | 130 | 100.3% | 100.8% | 101.9% | ||
| 1992 | 181 | 95.4% | 98.1% | 100.0% | ||
| 1993 | 178 | 97.4% | 100.0% | 100.8% | ||
| 1994 | 180 | 94.9% | 97.7% | 99.2% | ||
| 1995 | 231 | 98.3% | 99.7% | 101.1% | ||
| 1996 | 182 | 98.3% | 100.6% | 102.6% | ||
| 1997 | 239 | 97.9% | 99.5% | 101.1% | ||
| 1998 | 239 | 95.8% | 97.0% | 98.8% | ||
| 1999 | 236 | 95.9% | 97.7% | 99.7% | ||
| 2000 | 234 | 97.1% | 98.9% | 100.8% | ||
| 2001 | 193 | 96.3% | 98.5% | 100.9% |
| Hover over boxplot or outliers for additional information |
| Chart generated 03/09/2018 |
| - Silica, FIL, ICP-OES, LL - |
| Lab: NWQL, PCode: 00955, MCode: PLA09 |
| Login Dates: 10/08/92 through 09/27/94 |
| Open Data Set |
| Boxplot Description |
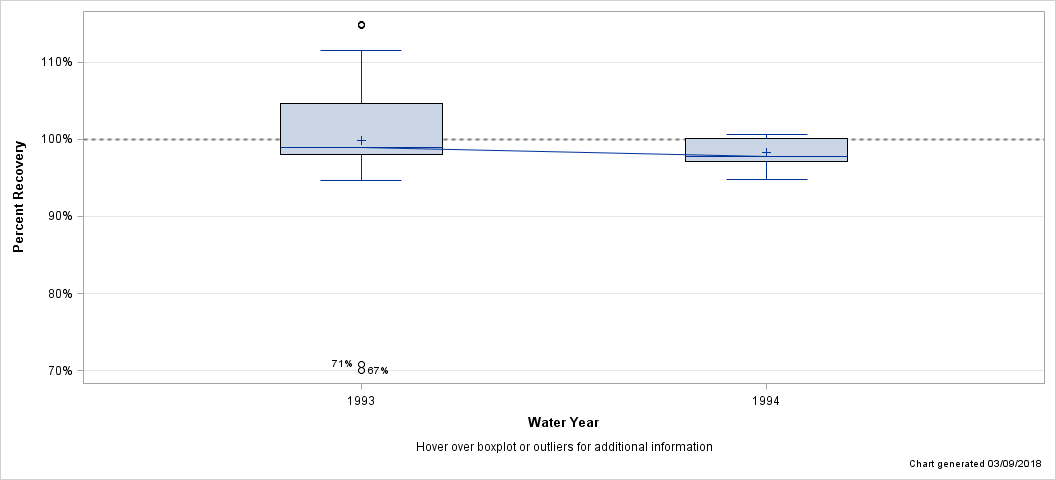
| Percent Recovery Statistics for Silica, FIL, ICP-OES, LL |
| Analyte | Parm-meth Code | Water Year | # of Samples |
25th Pctl | 50th Pctl (Median) |
75th Pctl |
|---|---|---|---|---|---|---|
| Silica, FIL, ICP-OES, LL | 00955PLA09 | 1993 | 24 | 98.0% | 99.0% | 104.6% |
| 1994 | 24 | 97.1% | 97.7% | 100.1% |
| Hover over boxplot or outliers for additional information |
| Chart generated 03/09/2018 |
| - Sodium, FIL, AA - |
| Lab: NWQL, PCode: 00930, MCode: AA035 |
| Login Dates: 10/15/86 through 03/29/96 |
| Open Data Set |
| Boxplot Description |
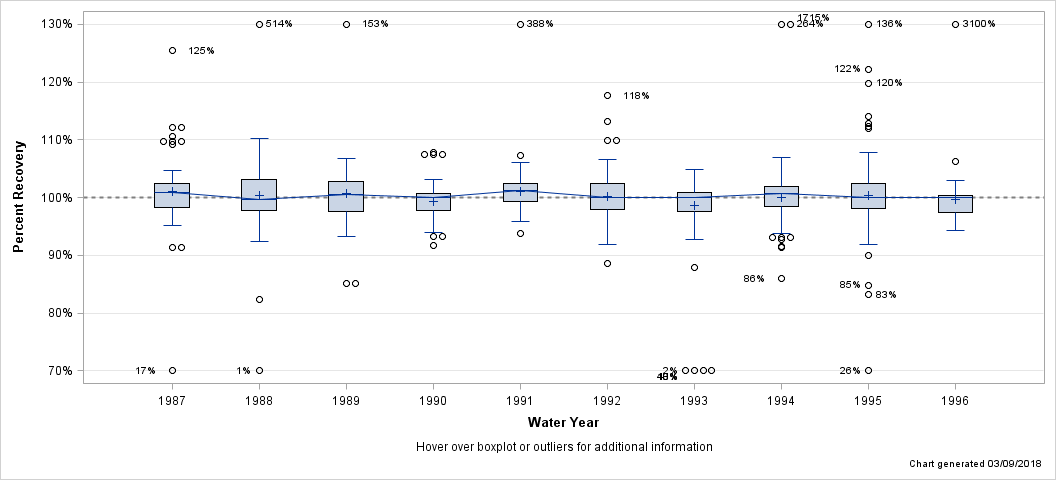
| Percent Recovery Statistics for Sodium, FIL, AA |
| Analyte | Parm-meth Code | Water Year | # of Samples |
25th Pctl | 50th Pctl (Median) |
75th Pctl |
|---|---|---|---|---|---|---|
| Sodium, FIL, AA | 00930AA035 | 1987 | 51 | 98.4% | 101.0% | 102.5% |
| 1988 | 83 | 97.7% | 99.6% | 103.2% | ||
| 1989 | 36 | 97.6% | 100.5% | 102.8% | ||
| 1990 | 137 | 97.7% | 100.0% | 100.7% | ||
| 1991 | 103 | 99.3% | 101.2% | 102.4% | ||
| 1992 | 124 | 97.9% | 100.0% | 102.4% | ||
| 1993 | 146 | 97.6% | 100.0% | 100.9% | ||
| 1994 | 125 | 98.4% | 100.8% | 101.9% | ||
| 1995 | 233 | 98.1% | 100.0% | 102.5% | ||
| 1996 | 63 | 97.5% | 100.0% | 100.3% |
| Hover over boxplot or outliers for additional information |
| Chart generated 03/09/2018 |
| - Sodium, FIL, AA, LL - |
| Lab: NWQL, PCode: 00930, MCode: AA036 |
| Login Dates: 10/09/86 through 07/24/96 |
| Open Data Set |
| Boxplot Description |
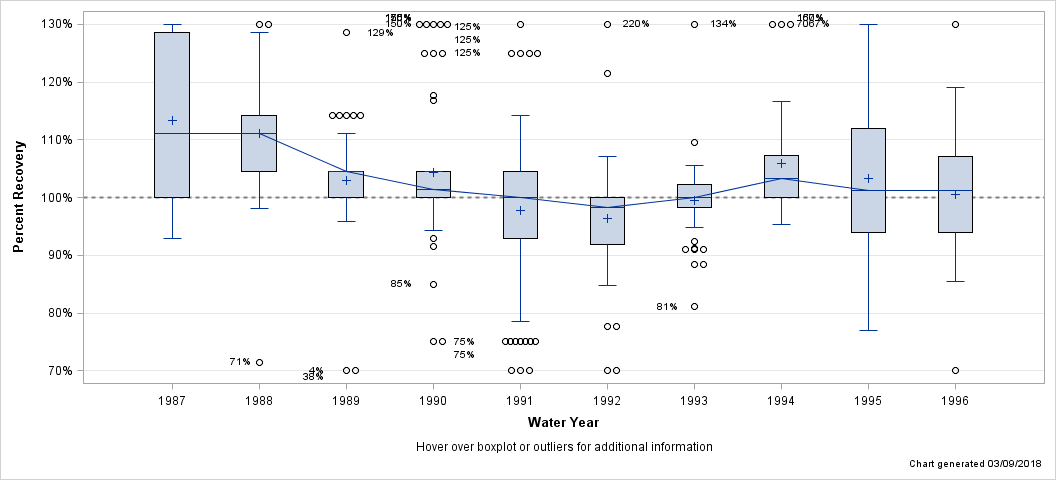
| Percent Recovery Statistics for Sodium, FIL, AA, LL |
| Analyte | Parm-meth Code | Water Year | # of Samples |
25th Pctl | 50th Pctl (Median) |
75th Pctl |
|---|---|---|---|---|---|---|
| Sodium, FIL, AA, LL | 00930AA036 | 1987 | 27 | 100.0% | 111.1% | 128.6% |
| 1988 | 34 | 104.6% | 111.1% | 114.3% | ||
| 1989 | 38 | 100.0% | 104.6% | 104.6% | ||
| 1990 | 55 | 100.0% | 101.4% | 104.6% | ||
| 1991 | 52 | 92.9% | 100.0% | 104.4% | ||
| 1992 | 69 | 91.9% | 98.3% | 100.0% | ||
| 1993 | 60 | 98.3% | 100.0% | 102.2% | ||
| 1994 | 36 | 100.0% | 103.4% | 107.2% | ||
| 1995 | 24 | 94.0% | 101.2% | 111.9% | ||
| 1996 | 19 | 94.0% | 101.2% | 107.1% |
| Hover over boxplot or outliers for additional information |
| Chart generated 03/09/2018 |
| - Sodium, FIL, ICP-OES - |
| Lab: NWQL, PCode: 00930, MCode: PLA11 |
| Login Dates: 10/14/86 through 09/27/01 |
| Open Data Set |
| Boxplot Description |
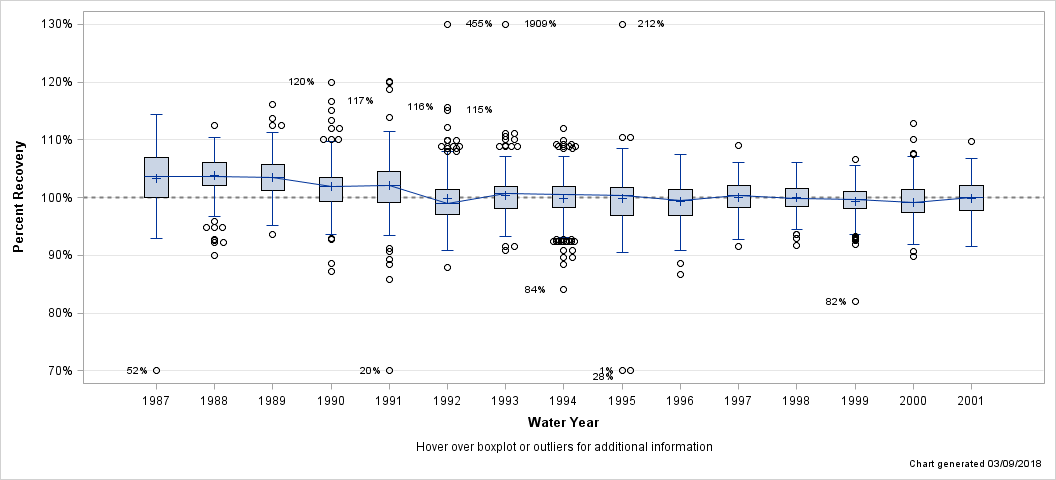
| Percent Recovery Statistics for Sodium, FIL, ICP-OES |
| Analyte | Parm-meth Code | Water Year | # of Samples |
25th Pctl | 50th Pctl (Median) |
75th Pctl |
|---|---|---|---|---|---|---|
| Sodium, FIL, ICP-OES | 00930PLA11 | 1987 | 150 | 100.0% | 103.6% | 107.0% |
| 1988 | 175 | 102.0% | 103.6% | 106.1% | ||
| 1989 | 218 | 101.2% | 103.4% | 105.7% | ||
| 1990 | 326 | 99.3% | 101.9% | 103.4% | ||
| 1991 | 352 | 99.2% | 102.0% | 104.5% | ||
| 1992 | 376 | 97.0% | 99.0% | 101.4% | ||
| 1993 | 350 | 98.0% | 100.6% | 101.8% | ||
| 1994 | 372 | 98.3% | 100.6% | 102.0% | ||
| 1995 | 232 | 97.0% | 100.4% | 101.7% | ||
| 1996 | 339 | 96.8% | 99.6% | 101.5% | ||
| 1997 | 240 | 98.3% | 100.4% | 102.1% | ||
| 1998 | 240 | 98.5% | 99.9% | 101.6% | ||
| 1999 | 237 | 98.0% | 99.6% | 101.1% | ||
| 2000 | 238 | 97.4% | 99.2% | 101.4% | ||
| 2001 | 197 | 97.8% | 100.0% | 102.2% |
| Hover over boxplot or outliers for additional information |
| Chart generated 03/09/2018 |
| - Sodium, FIL, ICP-OES, LL - |
| Lab: NWQL, PCode: 00930, MCode: PLA09 |
| Login Dates: 10/08/92 through 01/31/97 |
| Open Data Set |
| Boxplot Description |
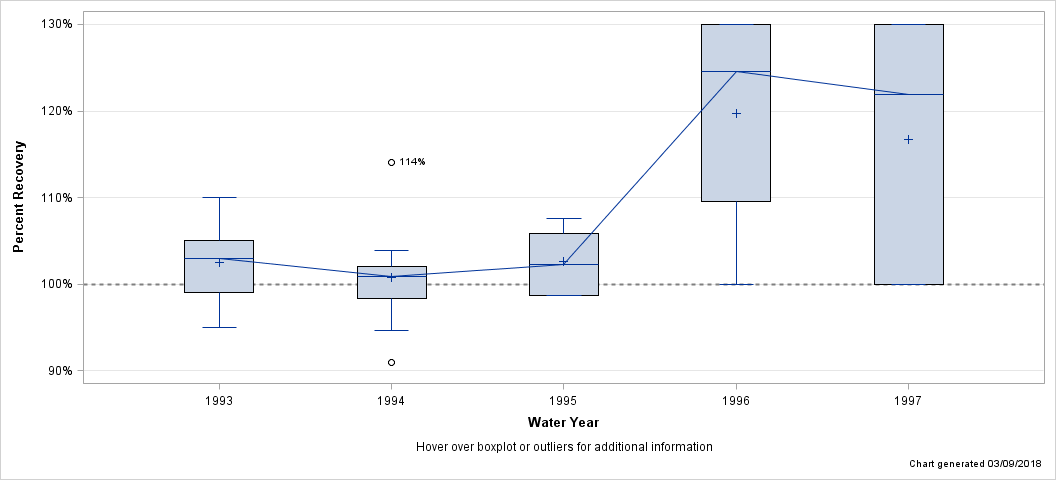
| Percent Recovery Statistics for Sodium, FIL, ICP-OES, LL |
| Analyte | Parm-meth Code | Water Year | # of Samples |
25th Pctl | 50th Pctl (Median) |
75th Pctl |
|---|---|---|---|---|---|---|
| Sodium, FIL, ICP-OES, LL | 00930PLA09 | 1993 | 24 | 99.0% | 102.9% | 105.0% |
| 1994 | 24 | 98.3% | 100.9% | 102.0% | ||
| 1995 | 11 | 98.7% | 102.2% | 105.8% | ||
| 1996 | 4 | 109.5% | 145.0% | 299.1% | ||
| 1997 | 8 | 100.0% | 122.0% | 170.9% |
| Hover over boxplot or outliers for additional information |
| Chart generated 03/09/2018 |
| - Solids, ROE@180 Deg C (TDS), FIL, GRAV - |
| Lab: NWQL, PCode: 70300, MCode: ROE10 |
| Login Dates: 10/14/86 through 09/27/01 |
| Open Data Set |
| Boxplot Description |
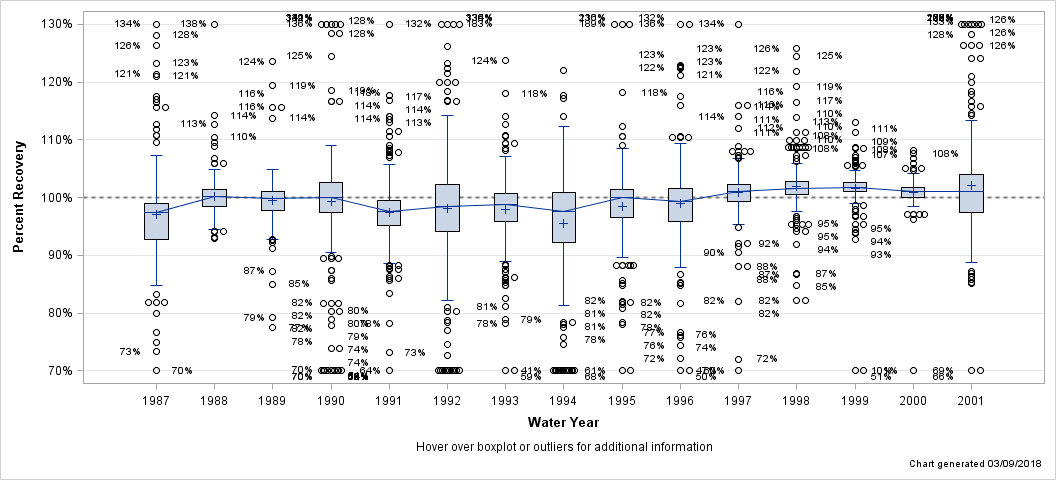
| Percent Recovery Statistics for Solids, ROE@180 Deg C (TDS), FIL, GRAV |
| Analyte | Parm-meth Code | Water Year | # of Samples |
25th Pctl | 50th Pctl (Median) |
75th Pctl |
|---|---|---|---|---|---|---|
| Solids, ROE@180 Deg C (TDS), FIL, GRAV | 70300ROE10 | 1987 | 192 | 92.7% | 97.5% | 99.1% |
| 1988 | 255 | 98.5% | 100.2% | 101.3% | ||
| 1989 | 254 | 97.7% | 99.8% | 101.1% | ||
| 1990 | 290 | 97.5% | 100.0% | 102.6% | ||
| 1991 | 259 | 95.1% | 97.5% | 99.5% | ||
| 1992 | 247 | 94.1% | 98.4% | 102.4% | ||
| 1993 | 243 | 95.8% | 98.8% | 100.7% | ||
| 1994 | 245 | 92.2% | 97.6% | 100.8% | ||
| 1995 | 234 | 96.6% | 100.0% | 101.4% | ||
| 1996 | 224 | 95.9% | 99.4% | 101.6% | ||
| 1997 | 240 | 99.4% | 101.0% | 102.3% | ||
| 1998 | 238 | 100.6% | 101.6% | 102.8% | ||
| 1999 | 234 | 101.1% | 101.8% | 102.6% | ||
| 2000 | 165 | 100.0% | 101.1% | 101.8% | ||
| 2001 | 238 | 97.4% | 101.1% | 104.0% |
| Hover over boxplot or outliers for additional information |
| Chart generated 03/09/2018 |
| - Specific Cond, LAB, UNF - |
| Lab: NWQL, PCode: 90095, MCode: WHT03 |
| Login Dates: 10/09/86 through 08/14/96 |
| Open Data Set |
| Boxplot Description |
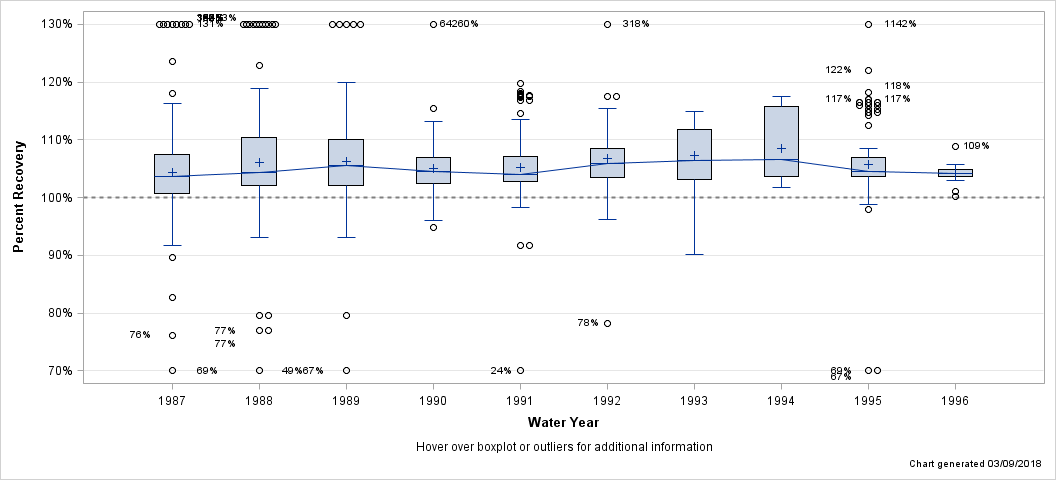
| Percent Recovery Statistics for Specific Cond, LAB, UNF |
| Analyte | Parm-meth Code | Water Year | # of Samples |
25th Pctl | 50th Pctl (Median) |
75th Pctl |
|---|---|---|---|---|---|---|
| Specific Cond, LAB, UNF | 90095WHT03 | 1987 | 299 | 100.7% | 103.7% | 107.4% |
| 1988 | 309 | 102.1% | 104.4% | 110.4% | ||
| 1989 | 292 | 102.1% | 105.5% | 110.0% | ||
| 1990 | 283 | 102.4% | 104.6% | 107.0% | ||
| 1991 | 247 | 102.7% | 104.0% | 107.2% | ||
| 1992 | 99 | 103.5% | 106.0% | 108.5% | ||
| 1993 | 99 | 103.2% | 106.4% | 111.9% | ||
| 1994 | 102 | 103.6% | 106.6% | 115.8% | ||
| 1995 | 161 | 103.6% | 104.5% | 106.9% | ||
| 1996 | 18 | 103.6% | 104.2% | 104.8% |
| Hover over boxplot or outliers for additional information |
| Chart generated 03/09/2018 |
| - Specific Cond, LAB, UNF, LL - |
| Lab: NWQL, PCode: 90095, MCode: WHT01 |
| Login Dates: 10/06/89 through 09/12/00 |
| Open Data Set |
| Boxplot Description |
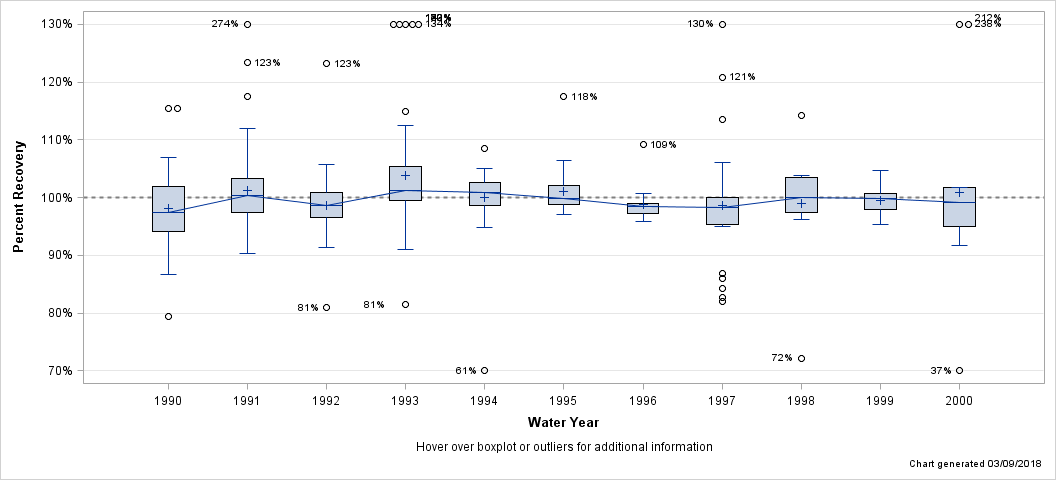
| Percent Recovery Statistics for Specific Cond, LAB, UNF, LL |
| Analyte | Parm-meth Code | Water Year | # of Samples |
25th Pctl | 50th Pctl (Median) |
75th Pctl |
|---|---|---|---|---|---|---|
| Specific Cond, LAB, UNF, LL | 90095WHT01 | 1990 | 56 | 94.1% | 97.5% | 102.0% |
| 1991 | 52 | 97.5% | 100.3% | 103.3% | ||
| 1992 | 69 | 96.6% | 98.6% | 100.9% | ||
| 1993 | 60 | 99.4% | 101.2% | 105.4% | ||
| 1994 | 36 | 98.6% | 100.8% | 102.6% | ||
| 1995 | 24 | 98.8% | 99.9% | 102.1% | ||
| 1996 | 19 | 97.2% | 98.4% | 99.0% | ||
| 1997 | 24 | 95.4% | 98.2% | 100.0% | ||
| 1998 | 12 | 97.4% | 100.0% | 103.5% | ||
| 1999 | 12 | 98.0% | 99.8% | 100.7% | ||
| 2000 | 12 | 95.1% | 99.2% | 101.7% |
| Hover over boxplot or outliers for additional information |
| Chart generated 03/09/2018 |
| - Sulfate, FIL - |
| Lab: NWQL, PCode: 00945, MCode: 00073 |
| Login Dates: 10/14/86 through 02/28/90 |
| Open Data Set |
| Boxplot Description |
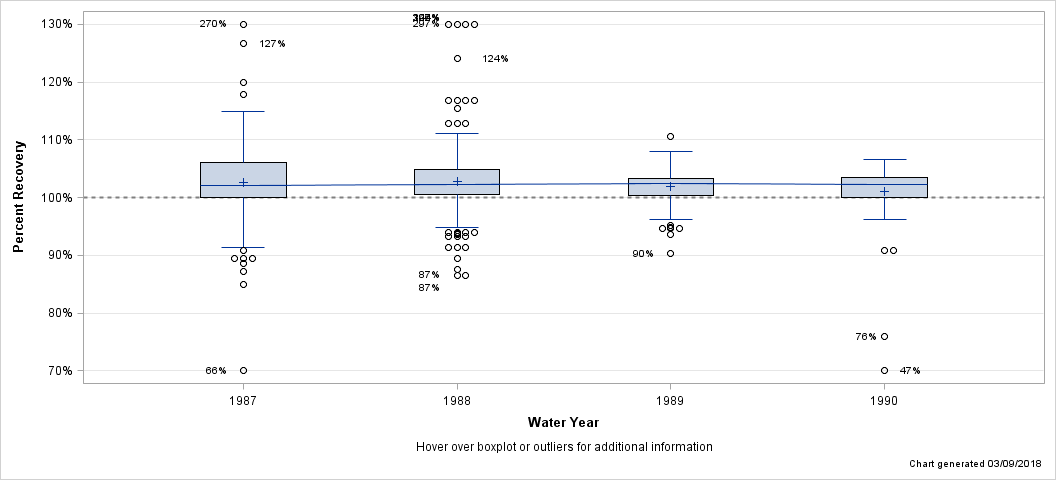
| Percent Recovery Statistics for Sulfate, FIL |
| Analyte | Parm-meth Code | Water Year | # of Samples |
25th Pctl | 50th Pctl (Median) |
75th Pctl |
|---|---|---|---|---|---|---|
| Sulfate, FIL | 0094500073 | 1987 | 209 | 100.0% | 102.0% | 106.0% |
| 1988 | 274 | 100.5% | 102.2% | 104.8% | ||
| 1989 | 181 | 100.4% | 102.5% | 103.4% | ||
| 1990 | 85 | 100.0% | 102.2% | 103.4% |
| Hover over boxplot or outliers for additional information |
| Chart generated 03/09/2018 |
| - Sulfate, FIL - |
| Lab: NWQL, PCode: 00945, MCode: CL065 |
| Login Dates: 05/28/87 through 06/04/87 |
| Open Data Set |
| Boxplot Description |
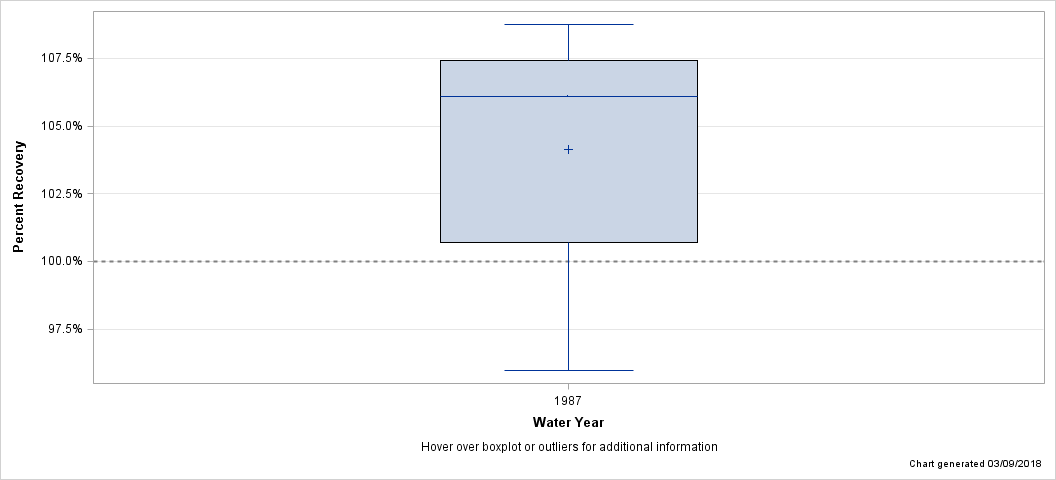
| Percent Recovery Statistics for Sulfate, FIL |
| Analyte | Parm-meth Code | Water Year | # of Samples |
25th Pctl | 50th Pctl (Median) |
75th Pctl |
|---|---|---|---|---|---|---|
| Sulfate, FIL | 00945CL065 | 1987 | 8 | 100.7% | 106.1% | 107.4% |
| Hover over boxplot or outliers for additional information |
| Chart generated 03/09/2018 |
| - Sulfate, FIL, IC - |
| Lab: NWQL, PCode: 00945, MCode: IC022 |
| Login Dates: 03/01/90 through 09/27/01 |
| Open Data Set |
| Boxplot Description |
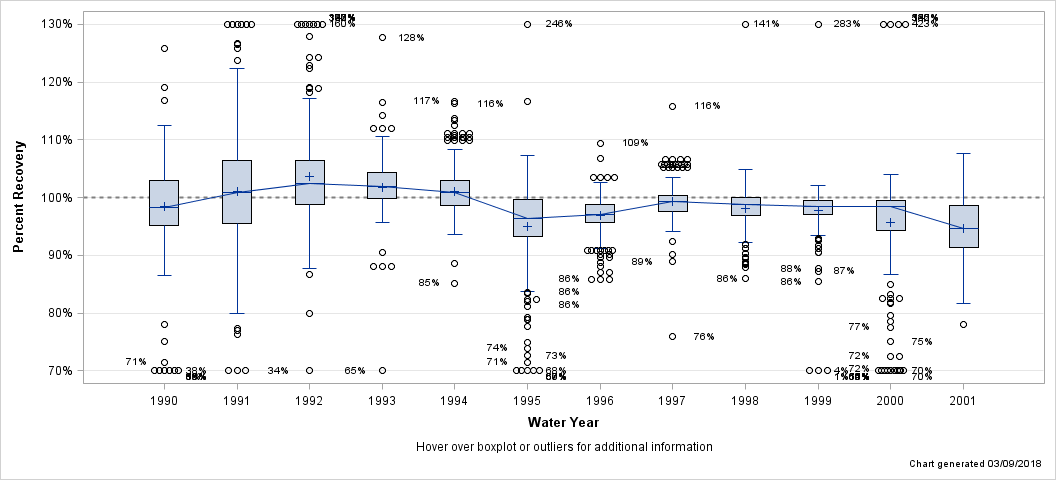
| Percent Recovery Statistics for Sulfate, FIL, IC |
| Analyte | Parm-meth Code | Water Year | # of Samples |
25th Pctl | 50th Pctl (Median) |
75th Pctl |
|---|---|---|---|---|---|---|
| Sulfate, FIL, IC | 00945IC022 | 1990 | 164 | 95.2% | 98.4% | 103.0% |
| 1991 | 265 | 95.5% | 100.9% | 106.4% | ||
| 1992 | 248 | 98.9% | 102.4% | 106.5% | ||
| 1993 | 242 | 99.8% | 101.9% | 104.3% | ||
| 1994 | 245 | 98.7% | 100.9% | 103.0% | ||
| 1995 | 234 | 93.3% | 96.3% | 99.7% | ||
| 1996 | 225 | 95.7% | 97.1% | 98.9% | ||
| 1997 | 240 | 97.5% | 99.4% | 100.3% | ||
| 1998 | 240 | 96.8% | 98.8% | 100.1% | ||
| 1999 | 237 | 97.0% | 98.5% | 99.5% | ||
| 2000 | 240 | 94.2% | 98.5% | 99.5% | ||
| 2001 | 239 | 91.3% | 94.7% | 98.6% |
| Hover over boxplot or outliers for additional information |
| Chart generated 03/09/2018 |
| - Sulfate, FIL, IC, LL - |
| Lab: NWQL, PCode: 00945, MCode: IC024 |
| Login Dates: 10/09/86 through 09/28/01 |
| Open Data Set |
| Boxplot Description |
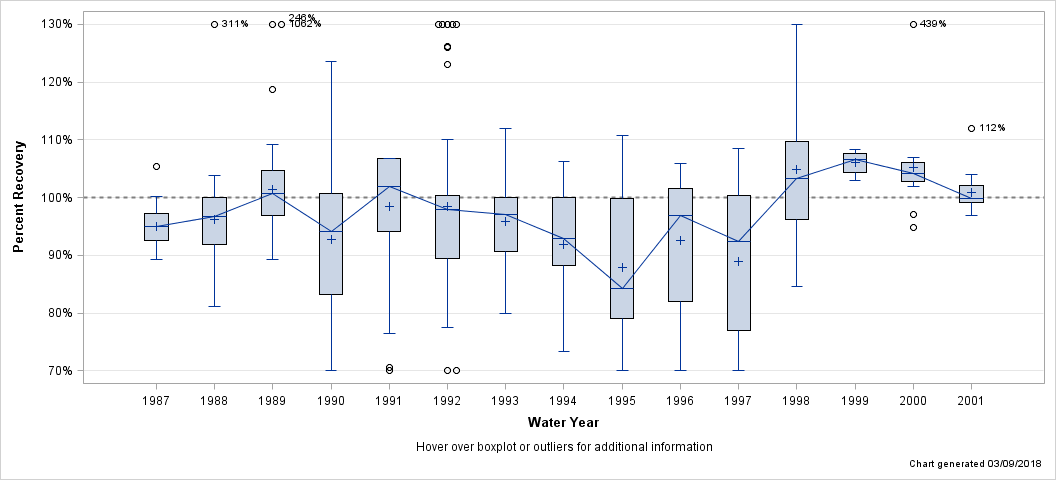
| Percent Recovery Statistics for Sulfate, FIL, IC, LL |
| Analyte | Parm-meth Code | Water Year | # of Samples |
25th Pctl | 50th Pctl (Median) |
75th Pctl |
|---|---|---|---|---|---|---|
| Sulfate, FIL, IC, LL | 00945IC024 | 1987 | 22 | 92.5% | 95.0% | 97.3% |
| 1988 | 30 | 91.9% | 96.8% | 100.0% | ||
| 1989 | 38 | 96.9% | 100.6% | 104.6% | ||
| 1990 | 52 | 83.2% | 94.1% | 100.8% | ||
| 1991 | 52 | 94.1% | 101.9% | 106.8% | ||
| 1992 | 69 | 89.4% | 98.0% | 100.3% | ||
| 1993 | 60 | 90.6% | 97.1% | 100.0% | ||
| 1994 | 35 | 88.2% | 93.0% | 100.0% | ||
| 1995 | 24 | 79.0% | 84.2% | 99.9% | ||
| 1996 | 22 | 82.0% | 96.8% | 101.6% | ||
| 1997 | 24 | 77.0% | 92.3% | 100.4% | ||
| 1998 | 11 | 96.3% | 103.4% | 109.8% | ||
| 1999 | 12 | 104.4% | 106.6% | 107.7% | ||
| 2000 | 12 | 102.8% | 104.2% | 106.0% | ||
| 2001 | 20 | 99.1% | 99.9% | 102.1% |
| Hover over boxplot or outliers for additional information |
| Chart generated 03/09/2018 |
| - Sulfate, FIL, TURB - |
| Lab: NWQL, PCode: 00945, MCode: 00074 |
| Login Dates: 04/21/89 through 02/26/90 |
| Open Data Set |
| Boxplot Description |
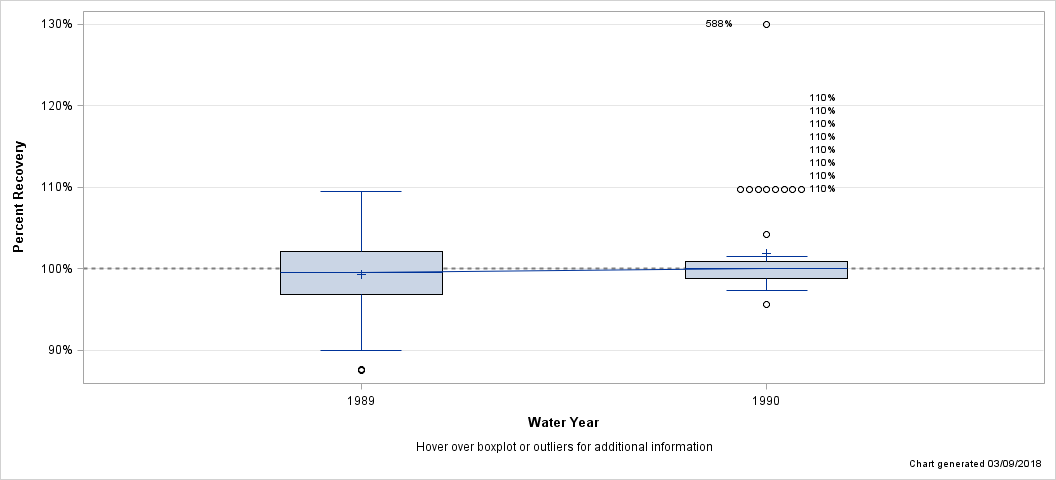
| Percent Recovery Statistics for Sulfate, FIL, TURB |
| Analyte | Parm-meth Code | Water Year | # of Samples |
25th Pctl | 50th Pctl (Median) |
75th Pctl |
|---|---|---|---|---|---|---|
| Sulfate, FIL, TURB | 0094500074 | 1989 | 73 | 96.9% | 99.6% | 102.2% |
| 1990 | 44 | 98.8% | 100.1% | 100.9% |
| Hover over boxplot or outliers for additional information |
| Chart generated 03/09/2018 |